Configuring NIFI Monotoring Splunk
Configuration
At this stage, all the necessary steps that must be carried out by the side of our nifi instances that are to be monitored will be detailed.
There are two ways of configuration that allow the sending of events to Splunk and their choice depends on the authentication mechanisms that NIFI has enabled.
-
Direct sending: This configuration will establish NIFI as the main way to send data to Splunk and should be used when NIFI does not have authentication methods enabled.
-
Splunk Data Input NiFi: Splunk will be in charge of making requests to the NIFI instances to retrieve the information from the Monitoring API by enabling and using the Data Input NIFI. This configuration should be used when NIFI has basic authentication.
[NOTE] Configure only one methodology, both running will generate duplicate information.
Direct Sending
1. Configuring HTTP Event Collector (HEC) in Splunk
Configuration of an HTTP Event Collector (HEC) is required. This allows events to be sent from nifi instances to a Splunk implementation via the HTTP and HTTPS protocols.
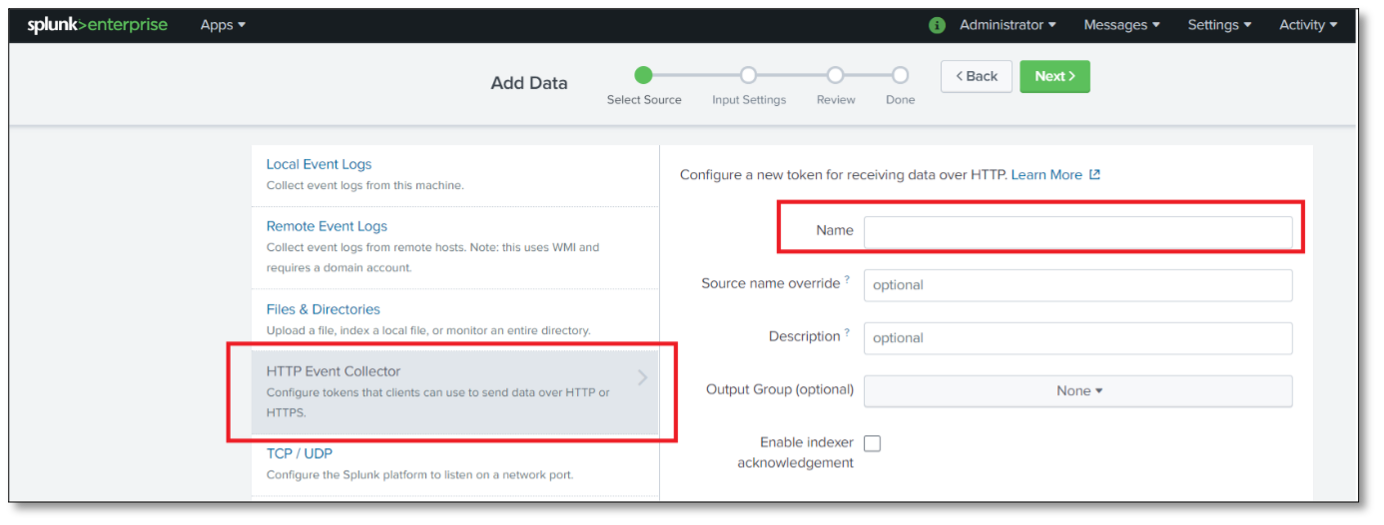
To configure, from the Splunk menu select Settings > Data Inputs. In the Local Inputs list, identify HTTP Event Collector and add a new one.
In the configuration process you must:
- Assign a name for the data input,
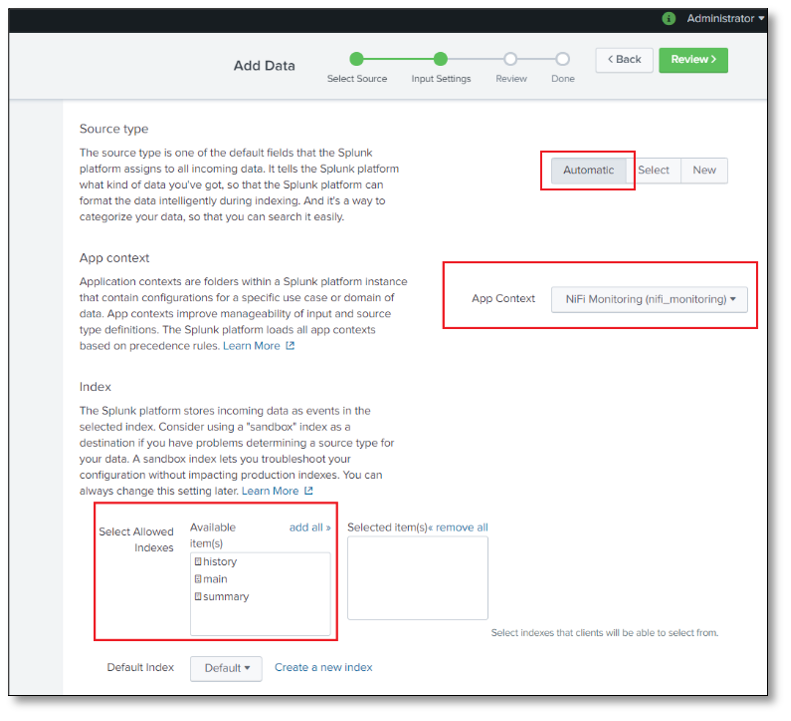
- Set the sourcetype to automatic,
- Select the App Context NIFI Monitoring and finally
- Select the Index where the data will be stored.
It is recommended to use a dedicated Index for this monitoring. If it does not exist, you must create it prior to this configuration.
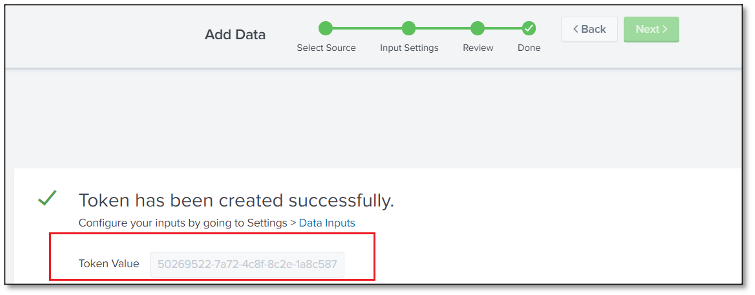
At the end of the configuration of this Event Collector, a Token Value will be created, which is necessary to later configure the sending of data from NIFI.
Configuration process:
2. Import Flow Definition in NIFI
Download and use the provided Flow Definition for NiFi Monitoring setup via this link NifiMonitoring. You can also find this file inside the flow_definition folder of the project.
The Flow Definition file is the structure of a group of processes in charge of collecting and executing the sending of NIFI data to Splunk. It is in JSON format which can be directly imported.
To import the Flow Definition, drag a process group box onto the nifi canvas
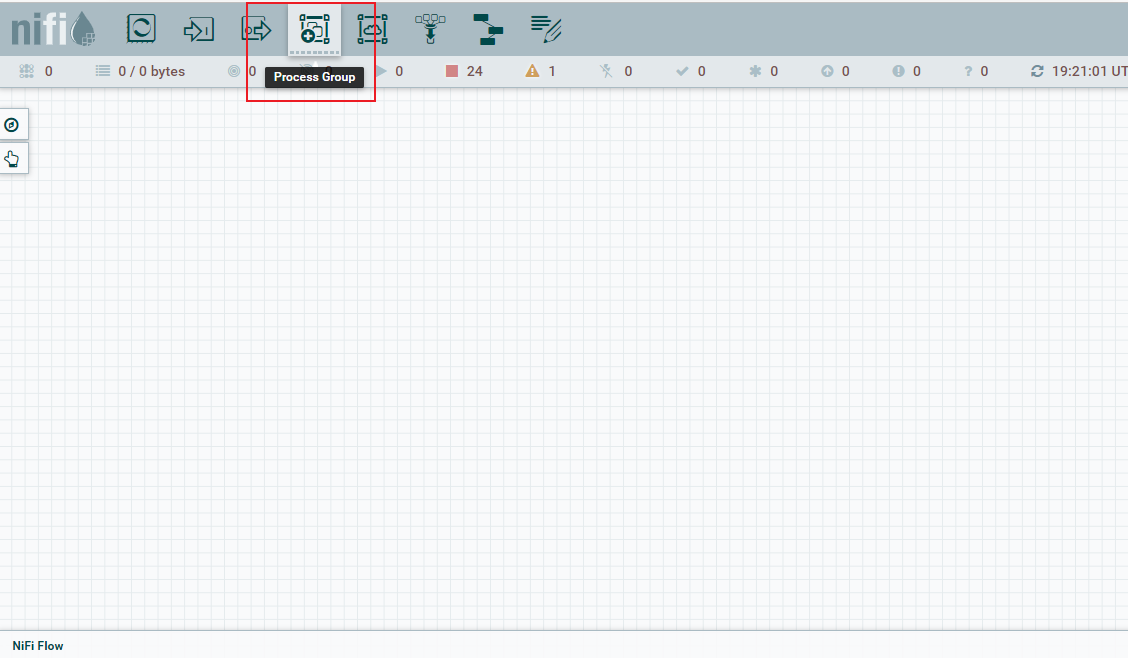
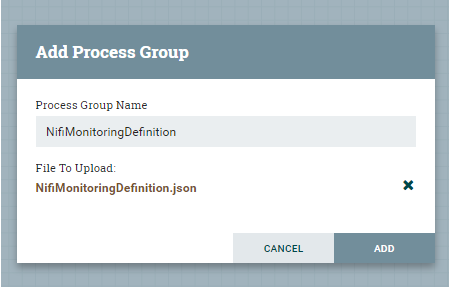
In the pop-up window, select the import icon, browse your computer, and select the NiFiMonitoring.json flow definition to import.
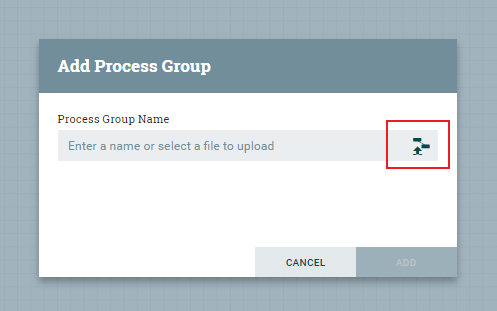
Once imported, click "add" to finish importing the flow definition.
Finally, you will see the processor group and inside it contains the following structure:
3. Global variables configuration
It is essential to configure global variables as they are imprescindible for their operation. To configure the parameters, right click on the NifiMonitoring box > Variables.
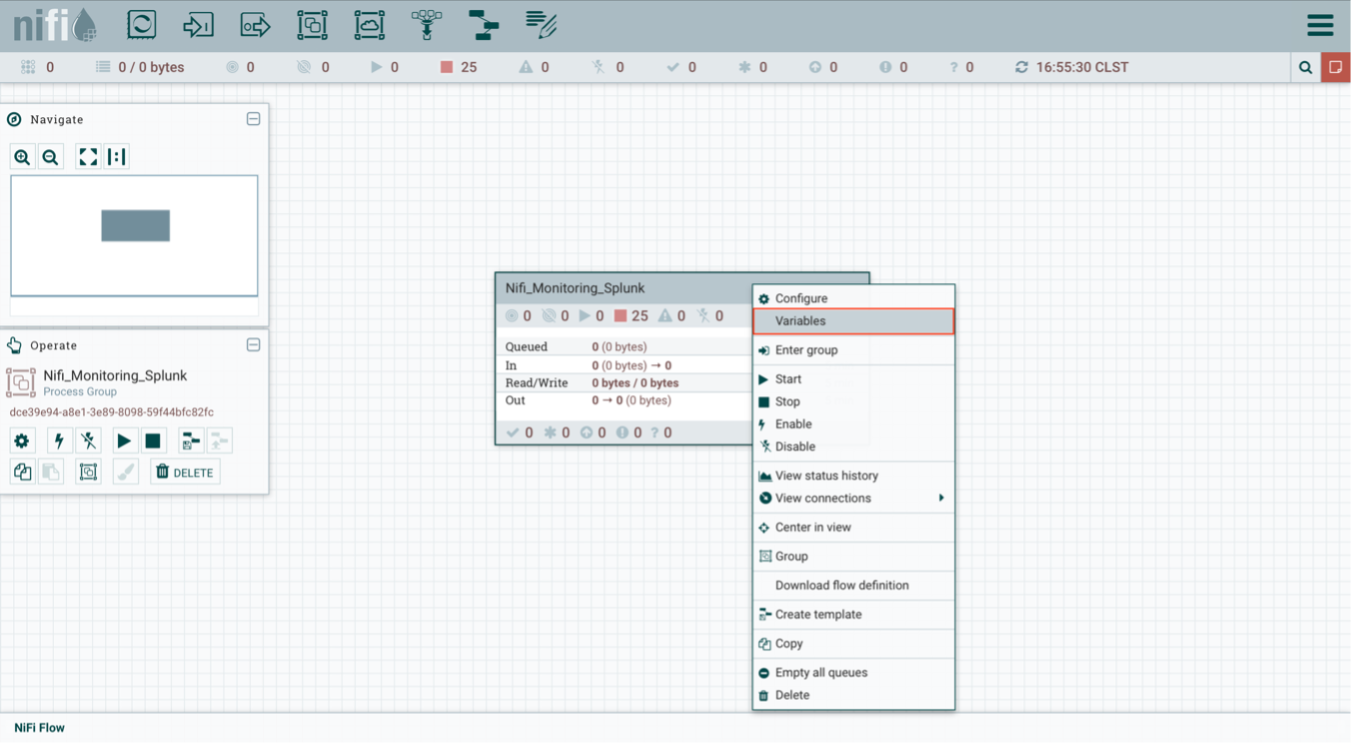
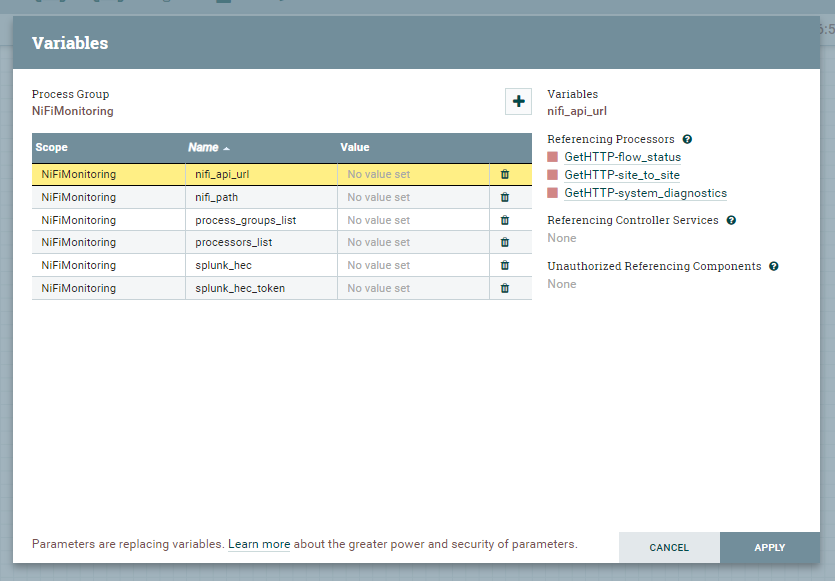
A pop-up window will be displayed where you will have to configure the following parameters:
- nifi_api_url: Corresponds to the route of the NIFI Rest API, (Eg: http://127.0.0.1:8080/nifi-api/)
- nifi_path: Corresponds to the nifi server installation path (in case of a cluster, it must be installed in the same path on each node). Example: /home/nifi/nifi-1.10.0/
- process_groups_list: List of IDs of process groups that need to be monitored, separated by line break.
- processors_list: List of Processor IDs that need to be monitored, separated by line break.
- splunk_hec: It is the address of the splunk server where the data input HTTP Event Collector was configured. (Eg. http://
:8088/) - splunk_hec_token: Token obtained when configuring HTTP Event Collector.
4. Components configuration
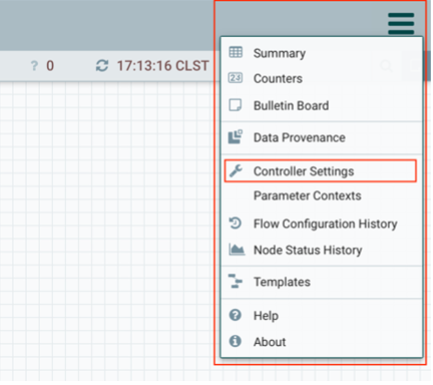
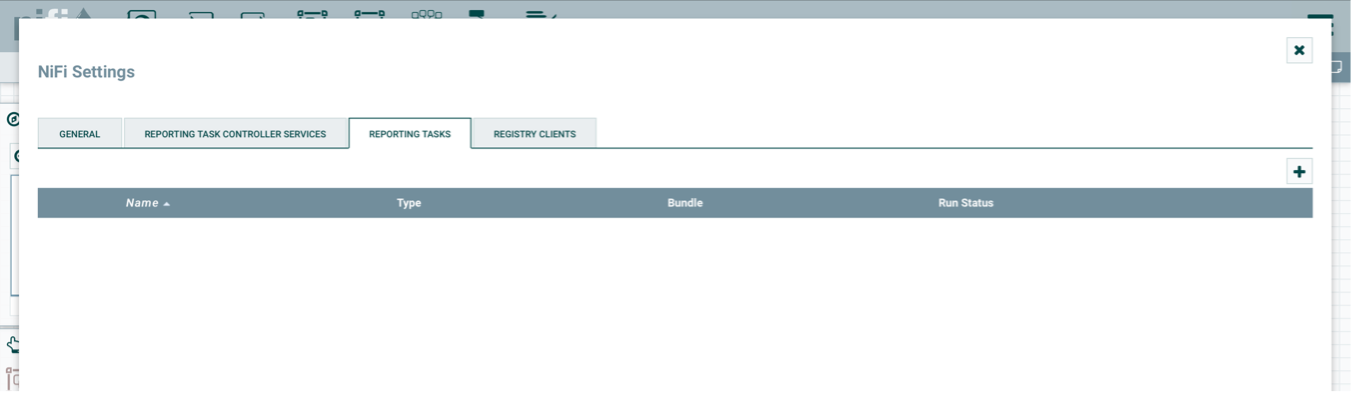
After configuring the variables, it is necessary to create the following components. To configure access Nifi Settings from the menu > Controller Settings
A pop-up window like the following will be displayed:
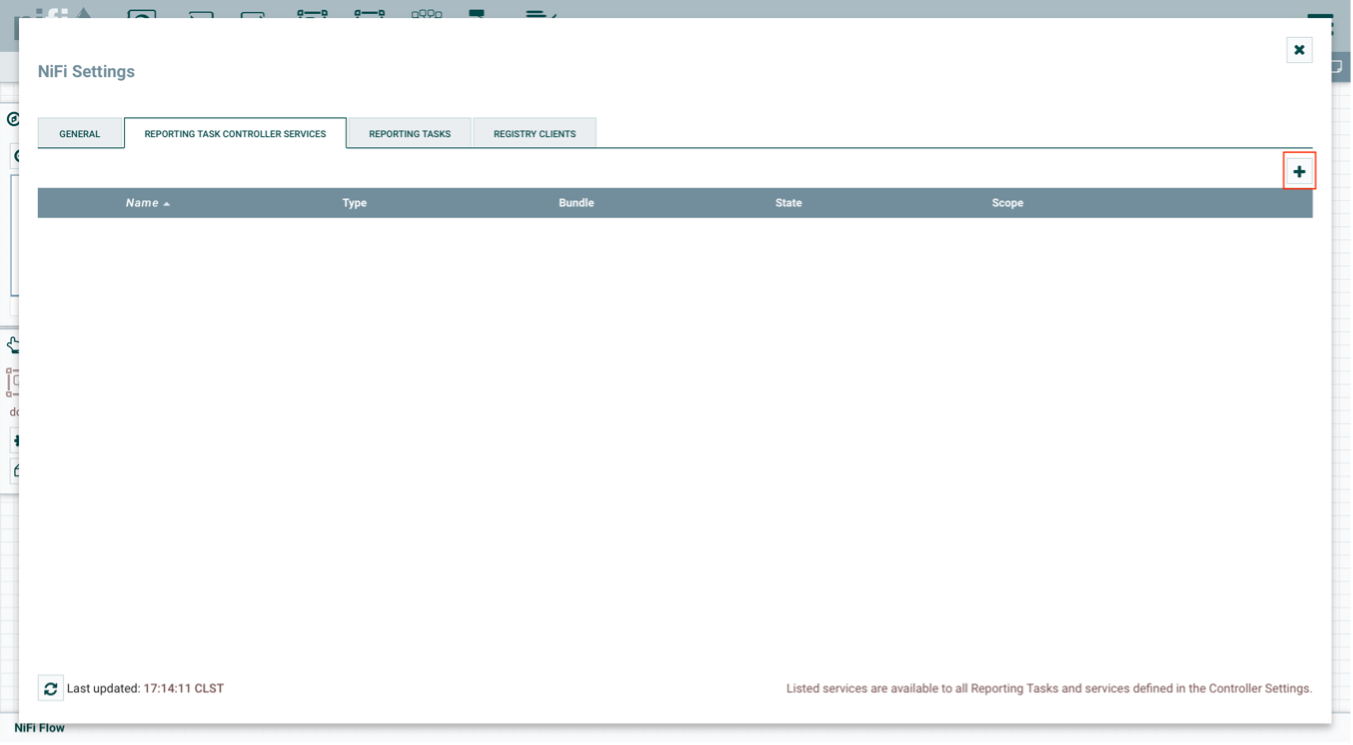
In the Reporting Task Controller Services tab, add the JsonRecordSetWriter controller service, which will allow parsing the results obtained from the Reporting Task service for later indexing in splunk. To add, click the (+) button
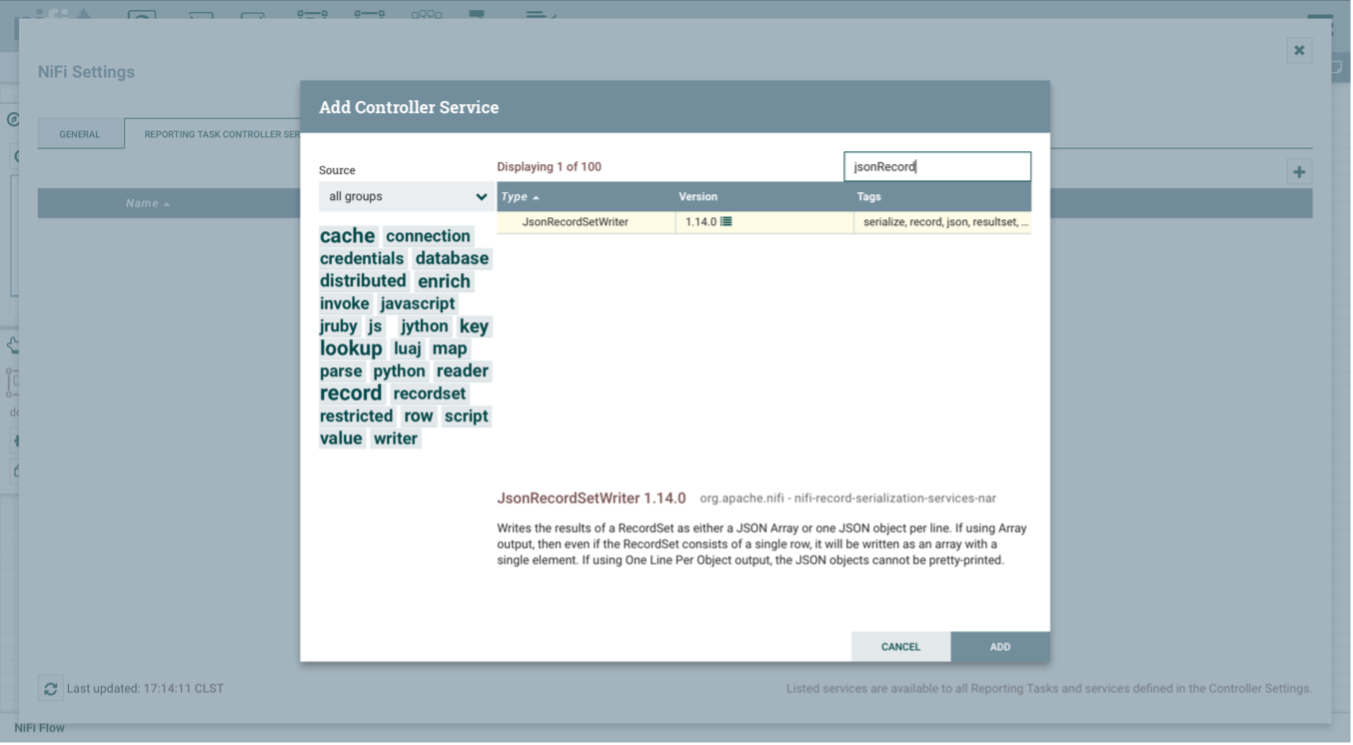
The window to add the controller will be displayed. Filter the list of options with the item to be added, select it and add it to the configuration.
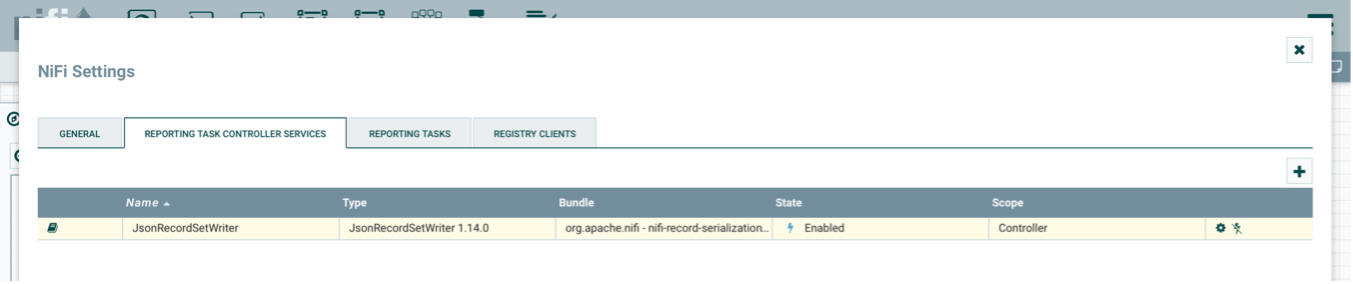
Once added, you must enable its operation by clicking on the lightning bolt icon (ϟ) and in the pop-up window confirm. This will enable the controller and you should have a configuration like the following.
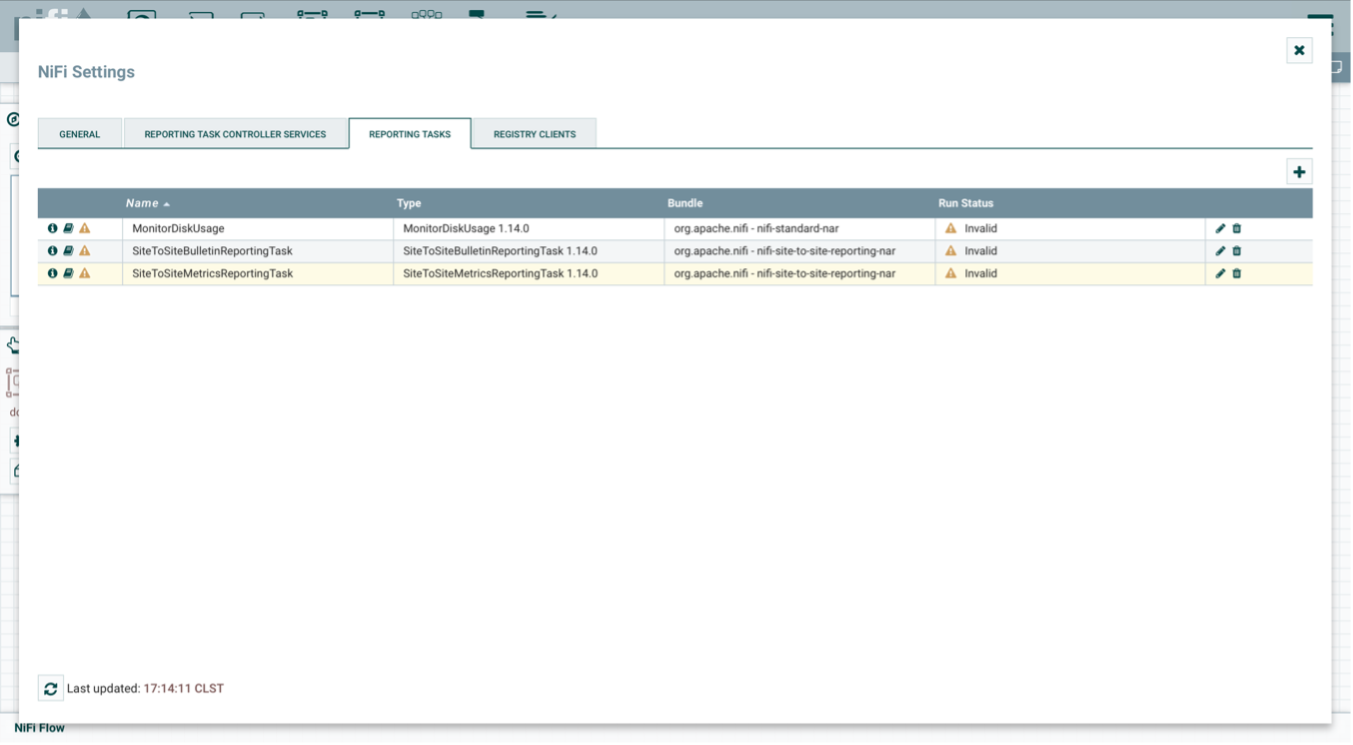
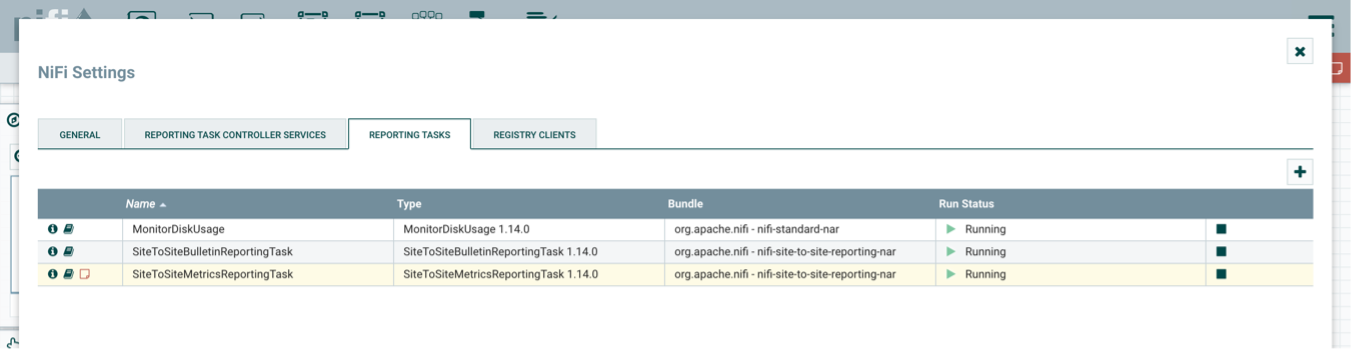
In this same window, in the Reporting Task tab, the following reports must be configured.
- MonitorDiskUsage
- SitetoSiteBulletinReportingTask
- SitetoSiteMetricsReportingTask
Add and find the required reporting tasks in the same way as the previous step, by clicking the (+) icon. Once added you can have a view like the following.
Configure task reports with the following information:
- MonitorDiskUsage: Internal reporting system that generates events as the threshold defined for the use of the filesystem is exceeded and captured in a specific flow.
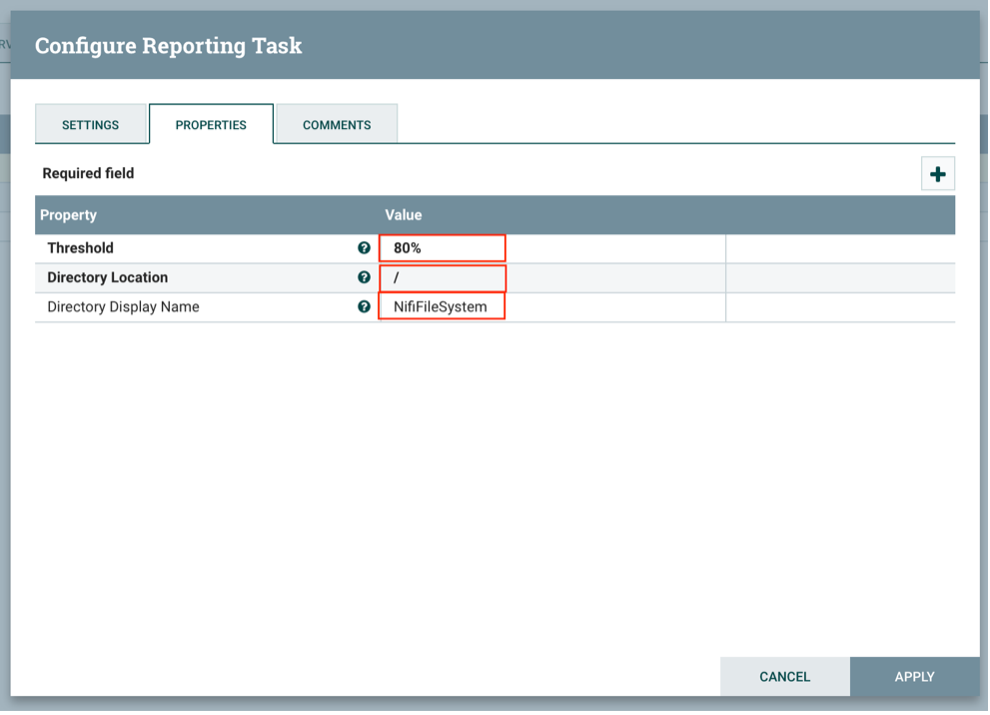
-
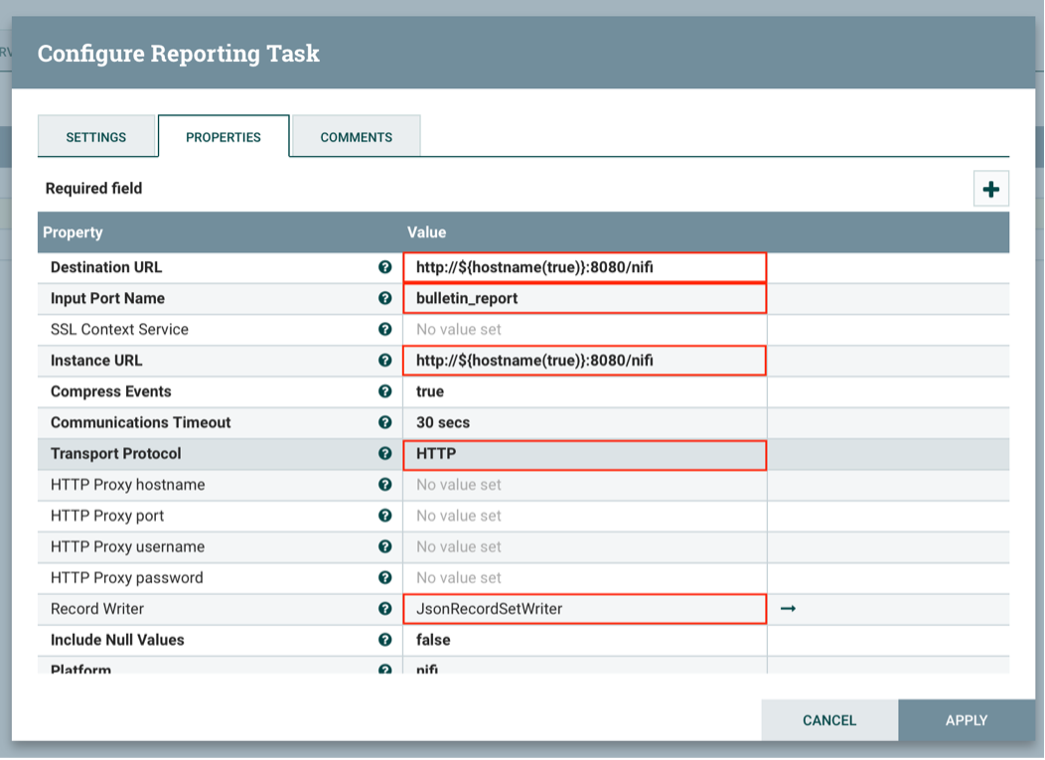
SiteToSiteBulletinReportingTask: Internal reporting system that generates events as bulletin type errors are generated and captured in a specific flow. The configuration should be as follows:
- Destination URL: http://${hostname(true)}:8080/nifi
- Input Port Name: bulletin_report
- Instance URL: http://${hostname(true)}:8080/nifi
- Transport Protocol: HTTP
- Record Writer: JsonRecordSetWriter
-
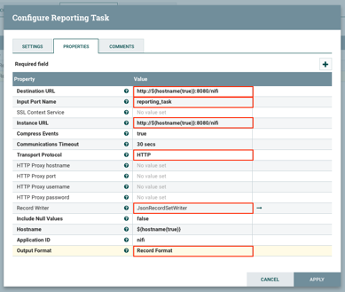
SiteToSiteMetricsReportingTask: Internal reporting system that generates events as metrics are generated from the same environment and captured in a specific flow. The configuration should be as follows:
- Destination URL: http://${hostname(true)}:8080/nifi
- Input Port Name: reporting_task
- Instance URL: http://${hostname(true)}:8080/nifi
- Transport Protocol: HTTP
- Record Writer: JsonRecordSetWriter
- Output Format: Record Formats
Once the reporting tasks have been configured, you must start the execution by clicking start (►) on each of them.
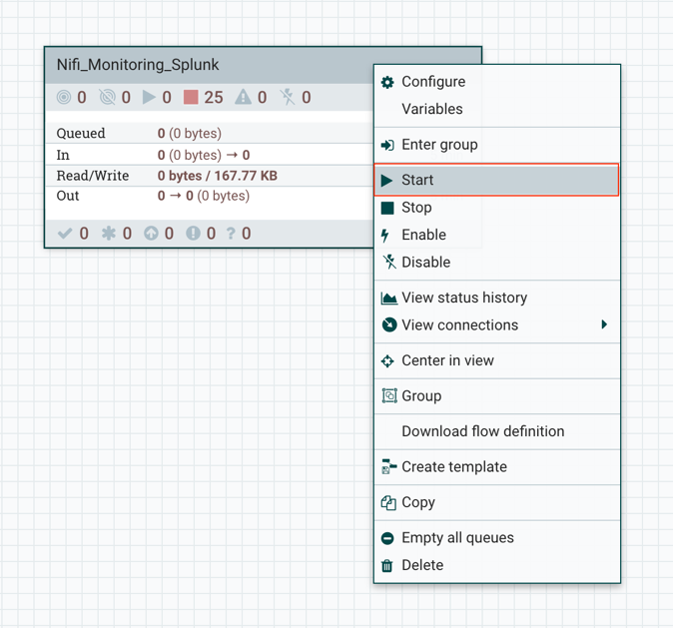
5. Enabling the sending of data
After completing the entire configuration process, start the process group execution. Right click on the process group and then Start.

If all the configuration was successful, the information will be sent to Splunk. For the data sent to splunk to be accessible from the application, you must have configured the NIFI Instances Lookup
Configuration of Nifi Data Input in Splunk
This configuration must be applied when the NIFI instances have at least basic authentication
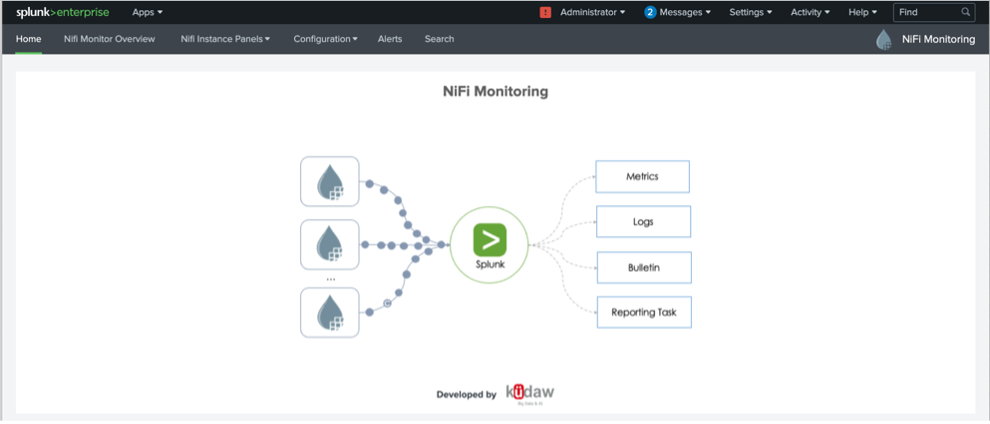
In the Splunk data inputs you can configure several resources, such as: NIFI Endpoints for monitoring System Diagnostics, Flow Status and Site to Site and the NIFI Status History for specific monitoring of processors and process groups based on their IDs. To configure, in the splunk where the Nifi Monitoring application is installed, access the Home of the APP.
Then in Settings Data Inputs
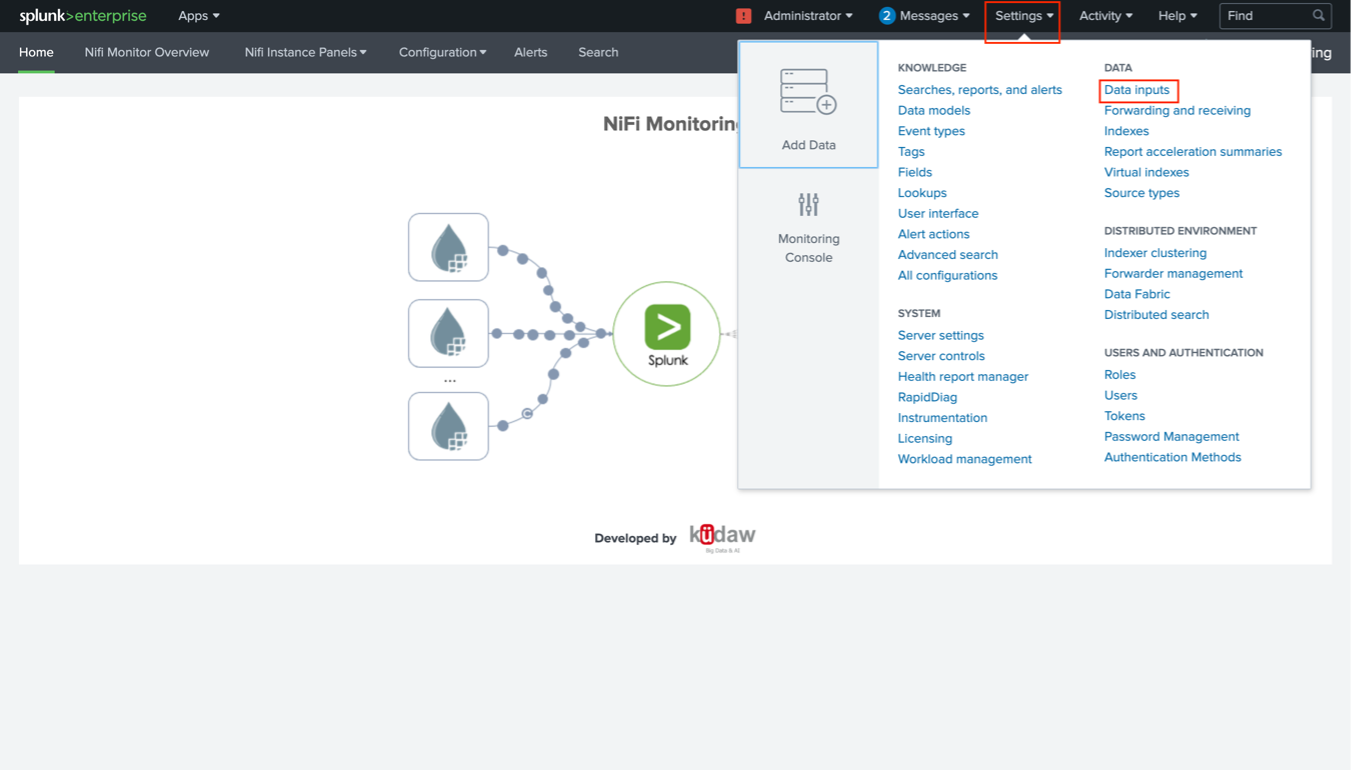
In the local data input, identify NiFi and then click on + Add new
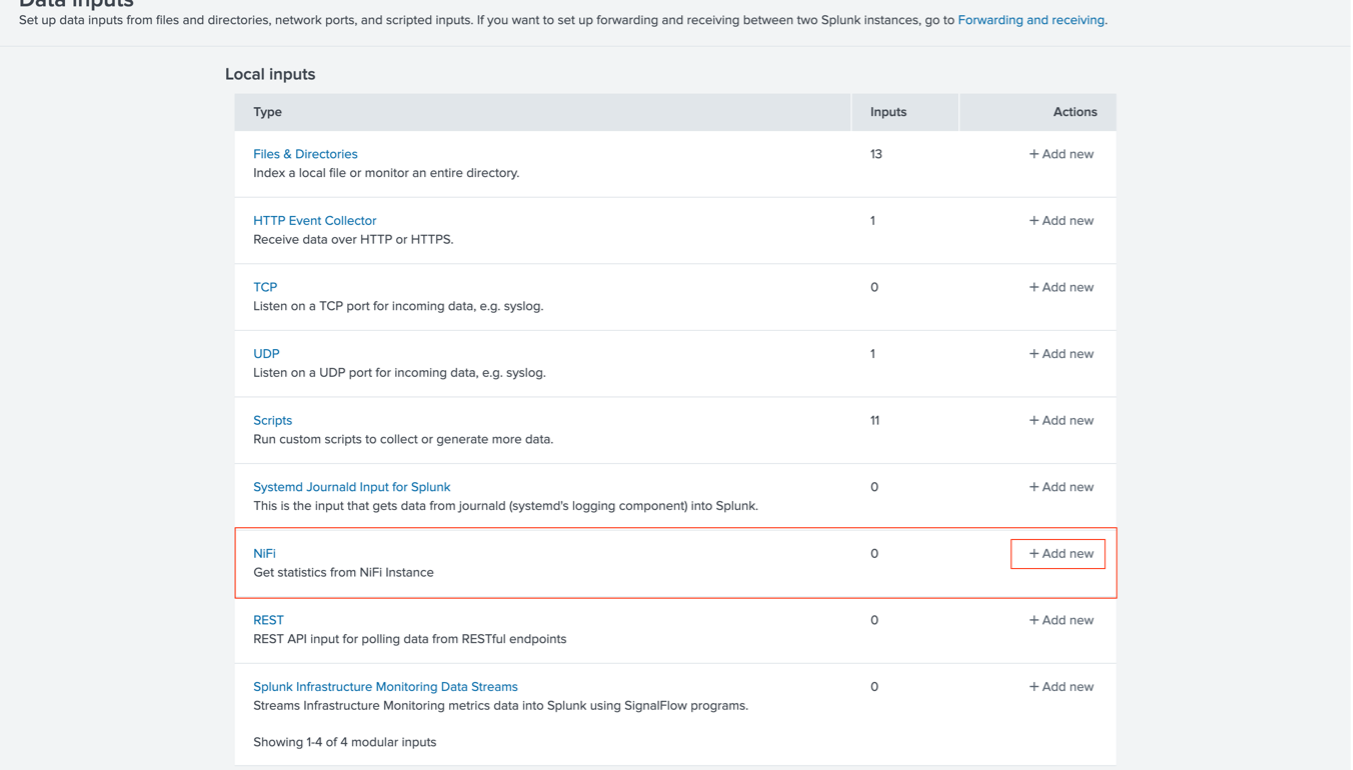
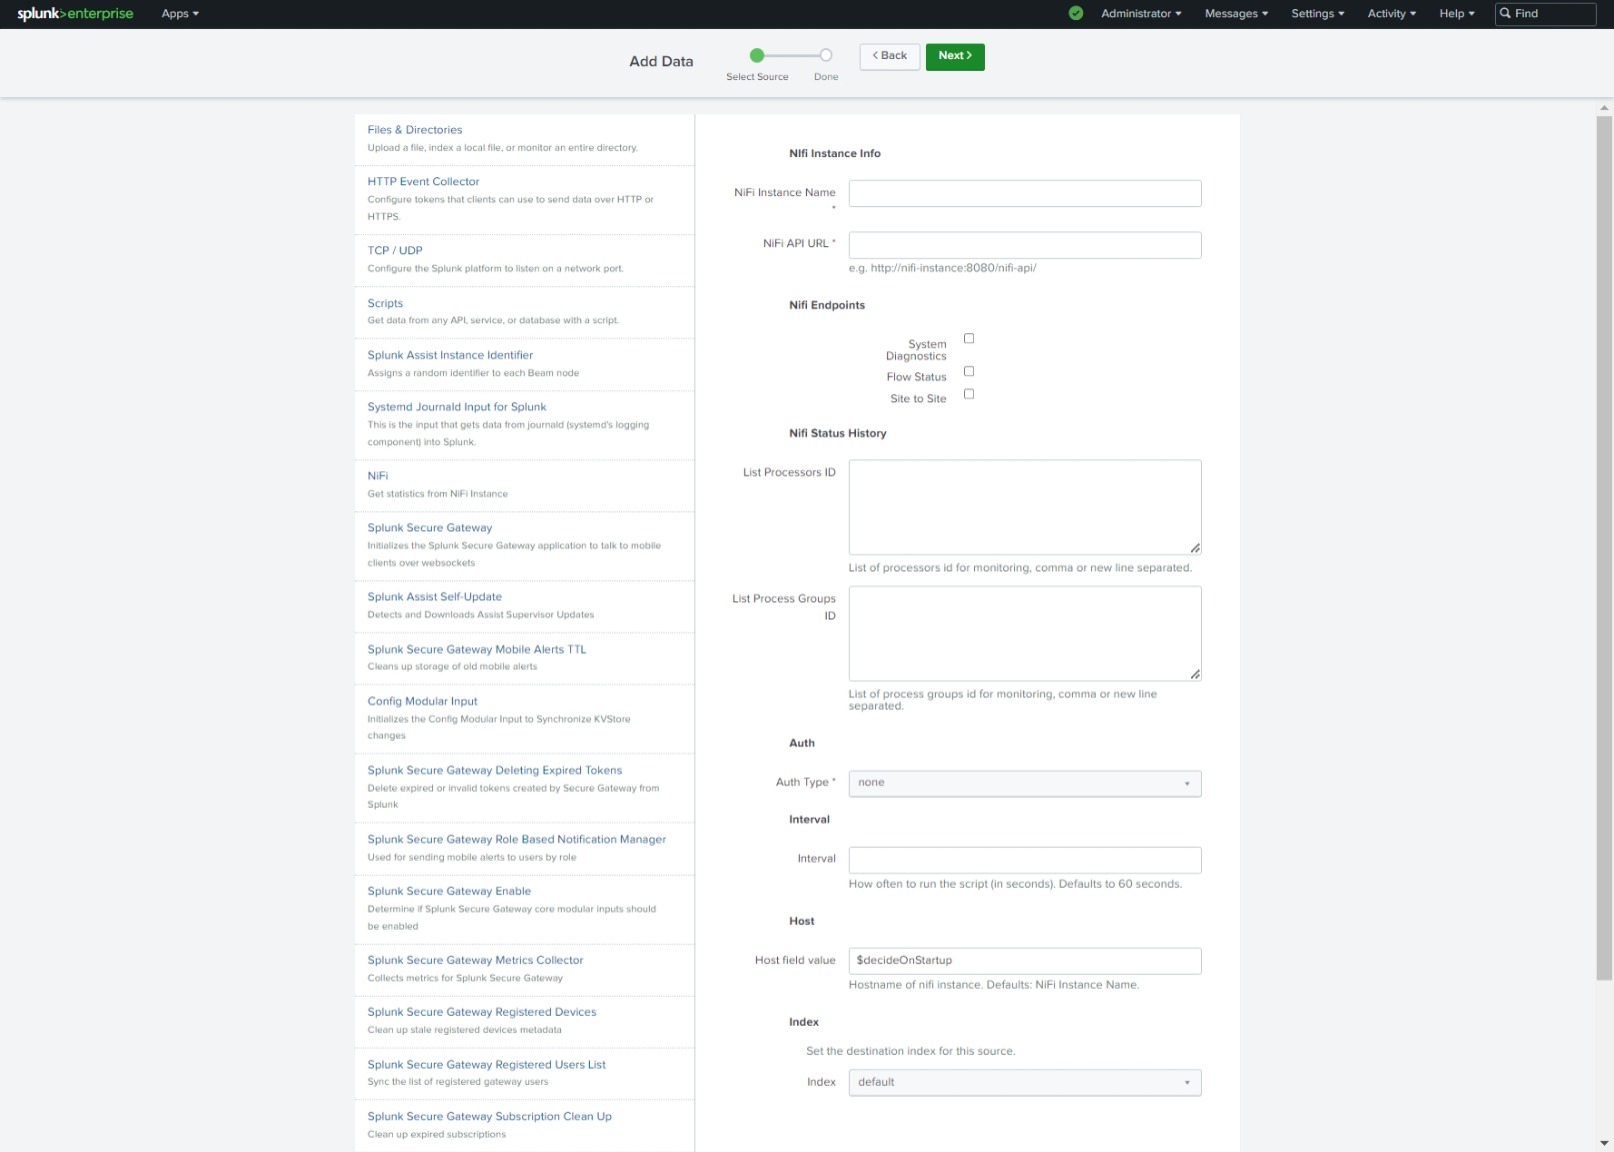
A window like the following will be displayed:
We recommend that you configure each of the monitoring resources independently for eventual changes in the configuration and due to execution times to obtain data.
The resources are:
- a. NIFI Endpoints
- b. NIFI Status History for Processors
- c. NIFI Status History for Process Groups
1. Basic resource configuration
For each of the resources you must configure all the required fields:
- NIFI Instance name: Assigns a name to the NIFI instance
- NIFI API URL: NIFI Rest API address. (eg. http://<address:port>/nifi-api/)
- Auth Type: Authentication type:
- none: No authentication
- basic: Access with username and password credentials
- Interval: Time in seconds in which the requests will be executed to extract the information, by default, 60 seconds.
- Host: Name of the nifi host, which must correspond to what is defined in the Configuration Lookup.
- Index: Destination index for this data source. A dedicated index is recommended, for example: nifi. If it does not exist, you must create it first.
a. NIFI Endpoints
In the NIFI Endpoints section, select the elements to monitor from the existing list.
- System Diagnostics
- Flow Status
- Site to Site
b. NIFI Status History for Processors
In the NIFI Status History > List Processors ID section, specify the processor IDs that will be monitored and separated by commas if there are several.
c. NIFI Status History for Process Groups
In the NIFI Status History > Process Groups ID section, specify the IDs of the process groups that will be monitored and separated by a comma if there are several.
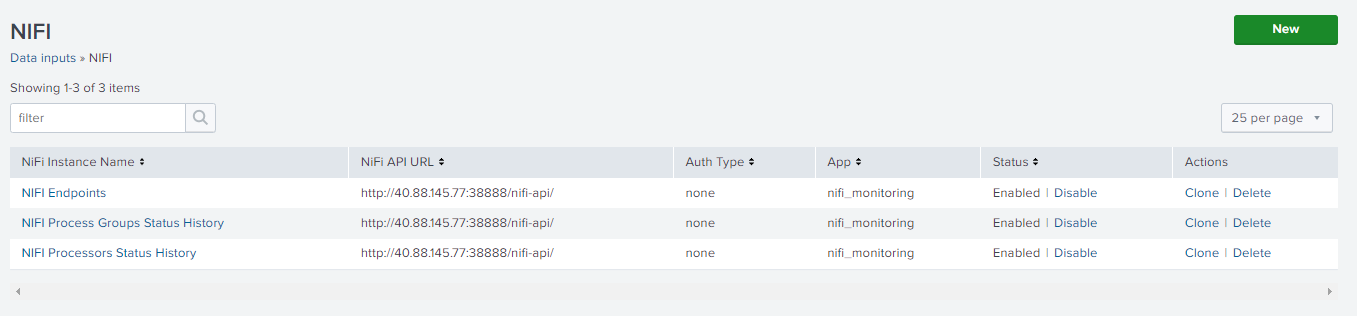
After the configuration is complete, click next and the creation will finish successfully
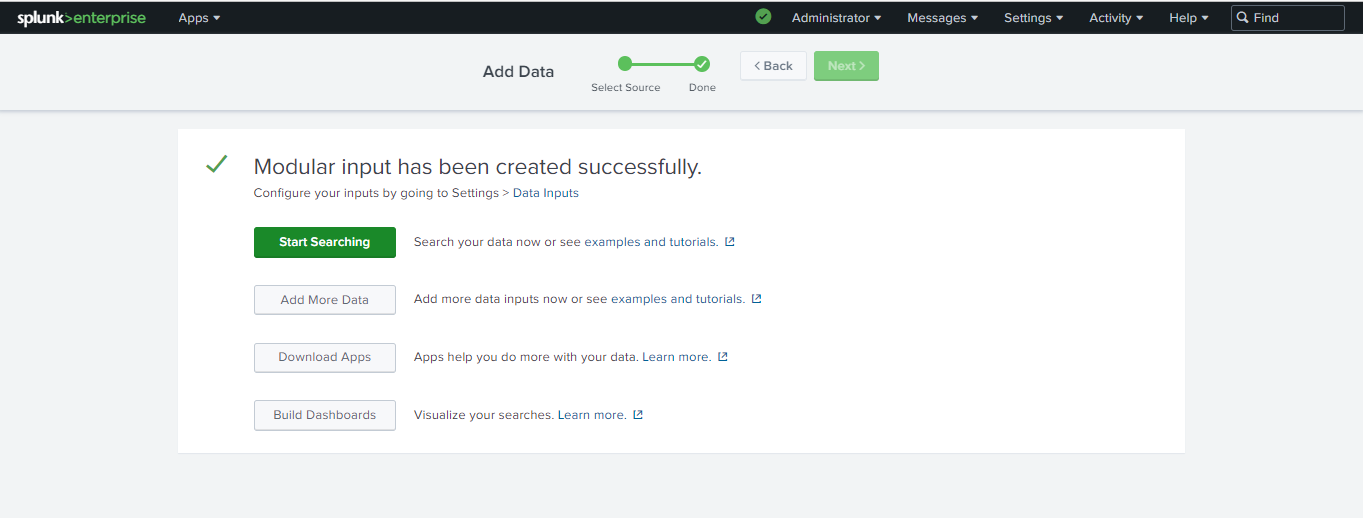
Repeat the configuration process for each resource you need to monitor.
Example of the 3 resources created independently
Transverse configuration
Regardless of the shipping methodology adopted, this configuration step is required for data display in the NIFI Monitoring Splunk application.
Instance Lookup
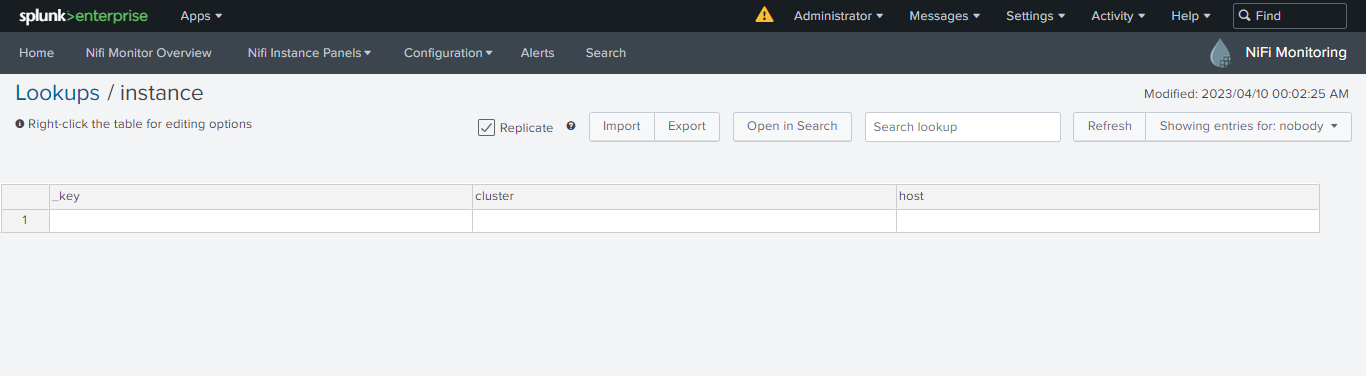
Go to Configuration > NiFi Instances to access the Lookups configuration view
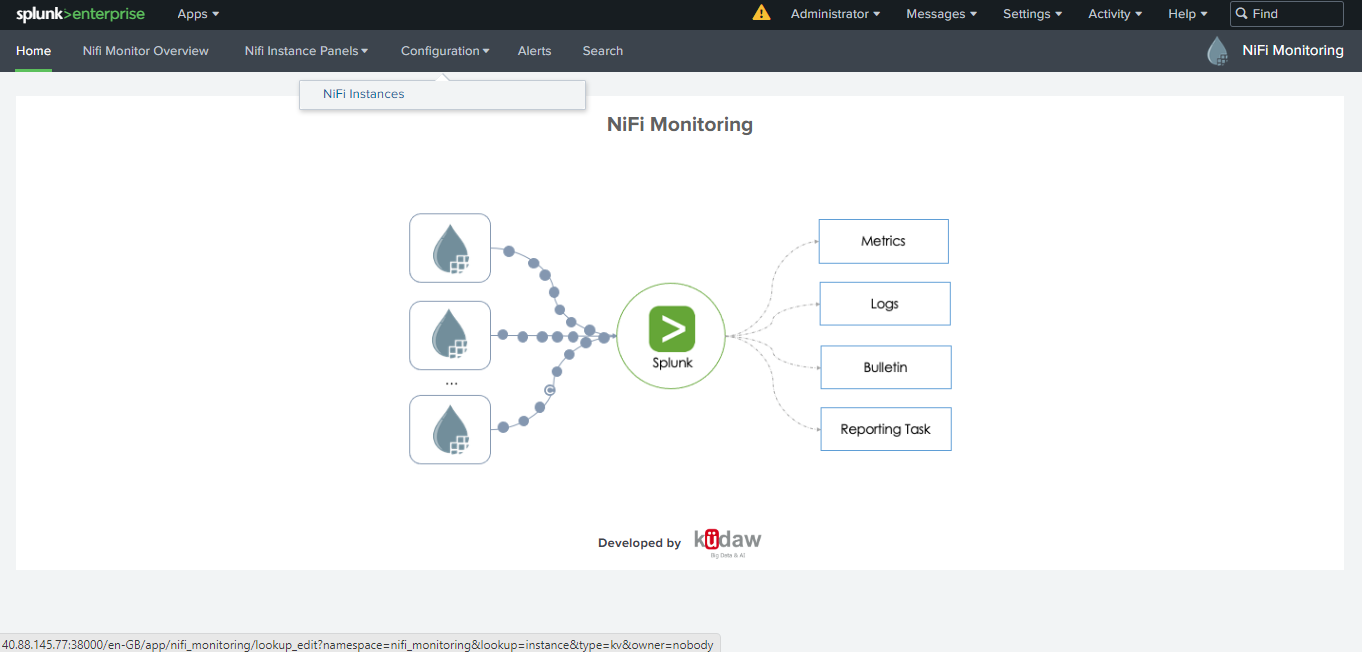
Complete the information in the fields, where the cluster label is to associate a group of nodes and host is the name of the instance.
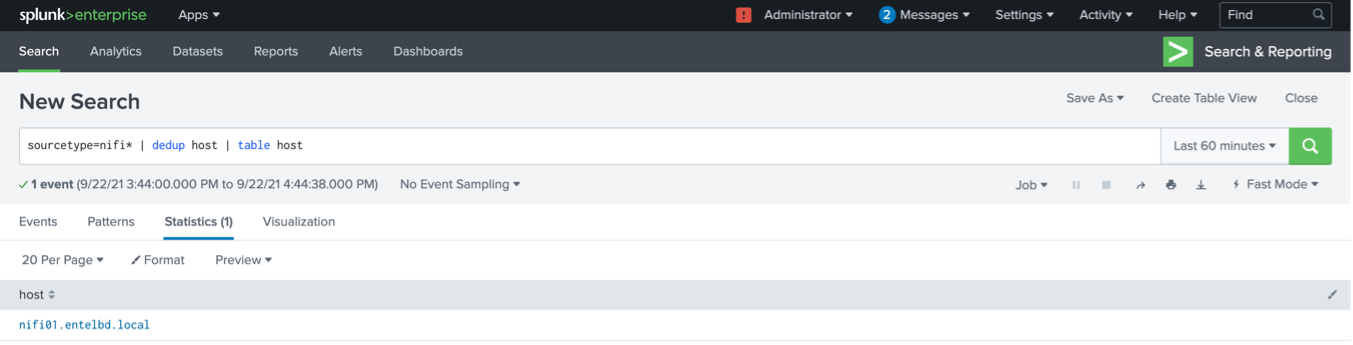
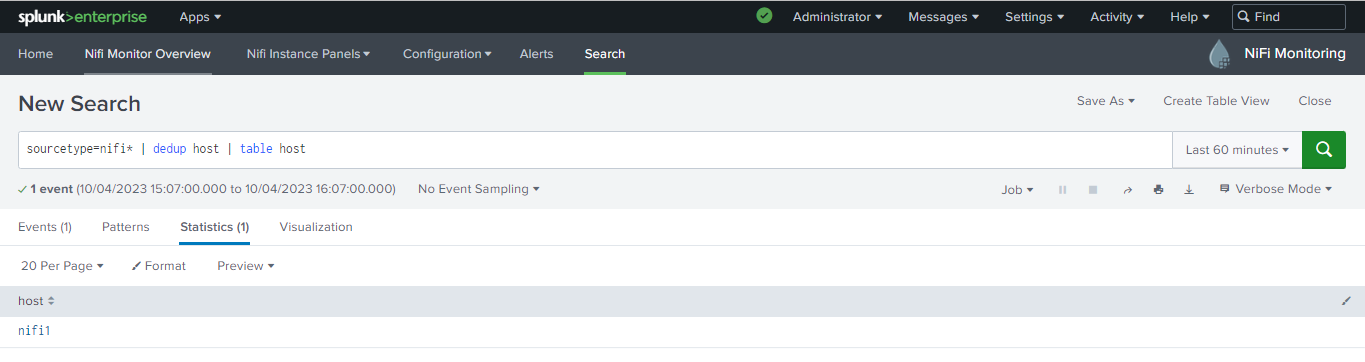
To obtain the name of the host, execute the following search with a time range of the last 60 minutes.
Splunk Query
sourcetype=nifi* | dedup host | table host
The result of this query will return the list of hosts that must be configured in the lookup.
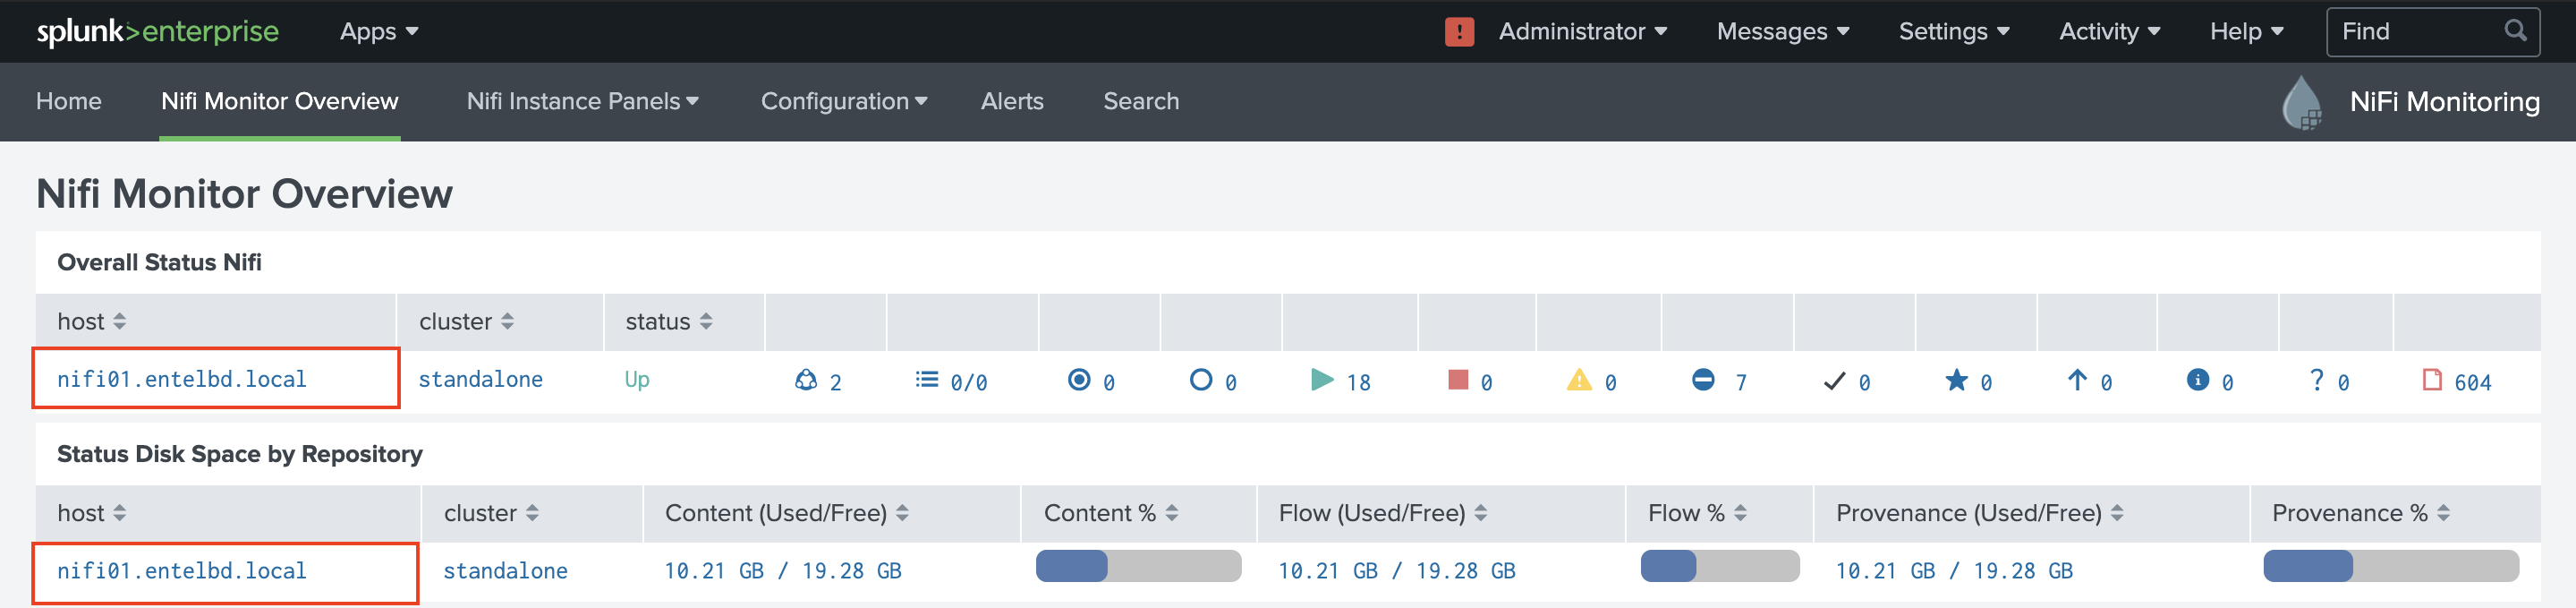
If the lookup is correctly configured, the information can be accessed from the Overview panel.
There are no results in the executed search?
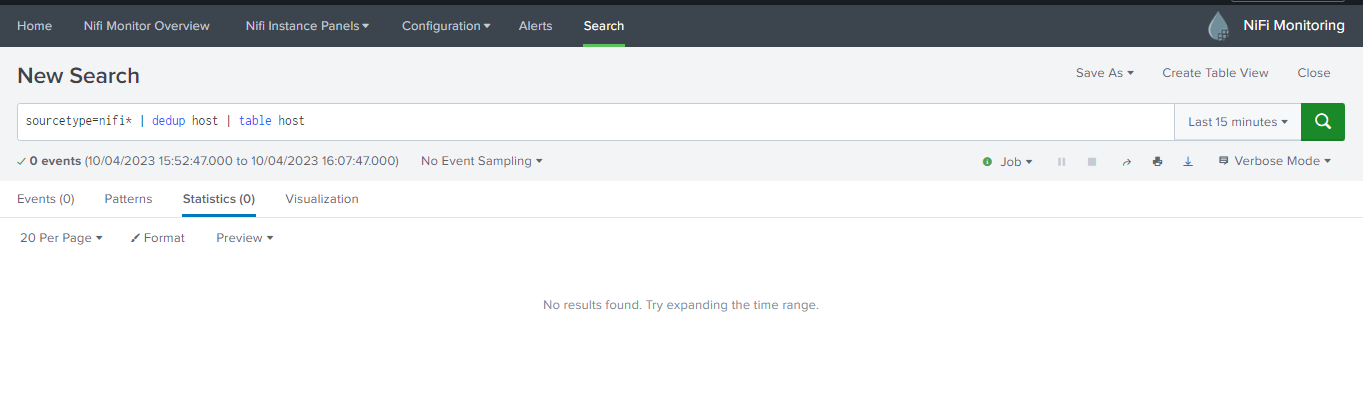
For this search to return results, the Nifi processes must be running correctly. According to the configuration methodology you must:
- Direct sending: You must start the NIFI processes How to enable data sending?
- Splunk Data Input NiFi: The configured data inputs must be enabled.