Overview
The application consists of the following navigation tree:
- App Nifi Monitoring
- Home
- Nifi Monitor Overview
- Nifi Instance Panels
- Flow's & Metrics Monitoring Panel
- Bulletin Monitoring Panel
- Logs Monitoring Panel
- Configuration
- Lookups
- NiFi Instances
- Alerts
- Search
Home
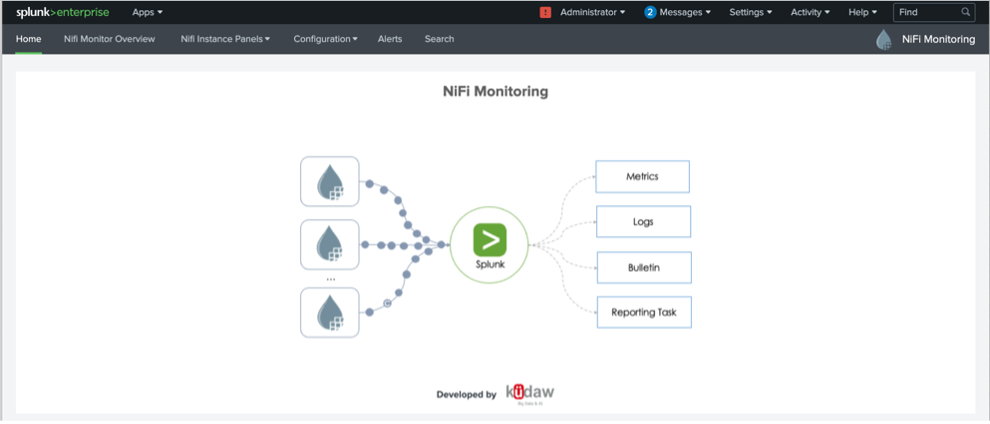
The main page of NIFI Monitoring App where you can see a small diagram that shows the type of information obtained from the NIFI servers to be analyzed by Splunk
NIFI Monitor Overview
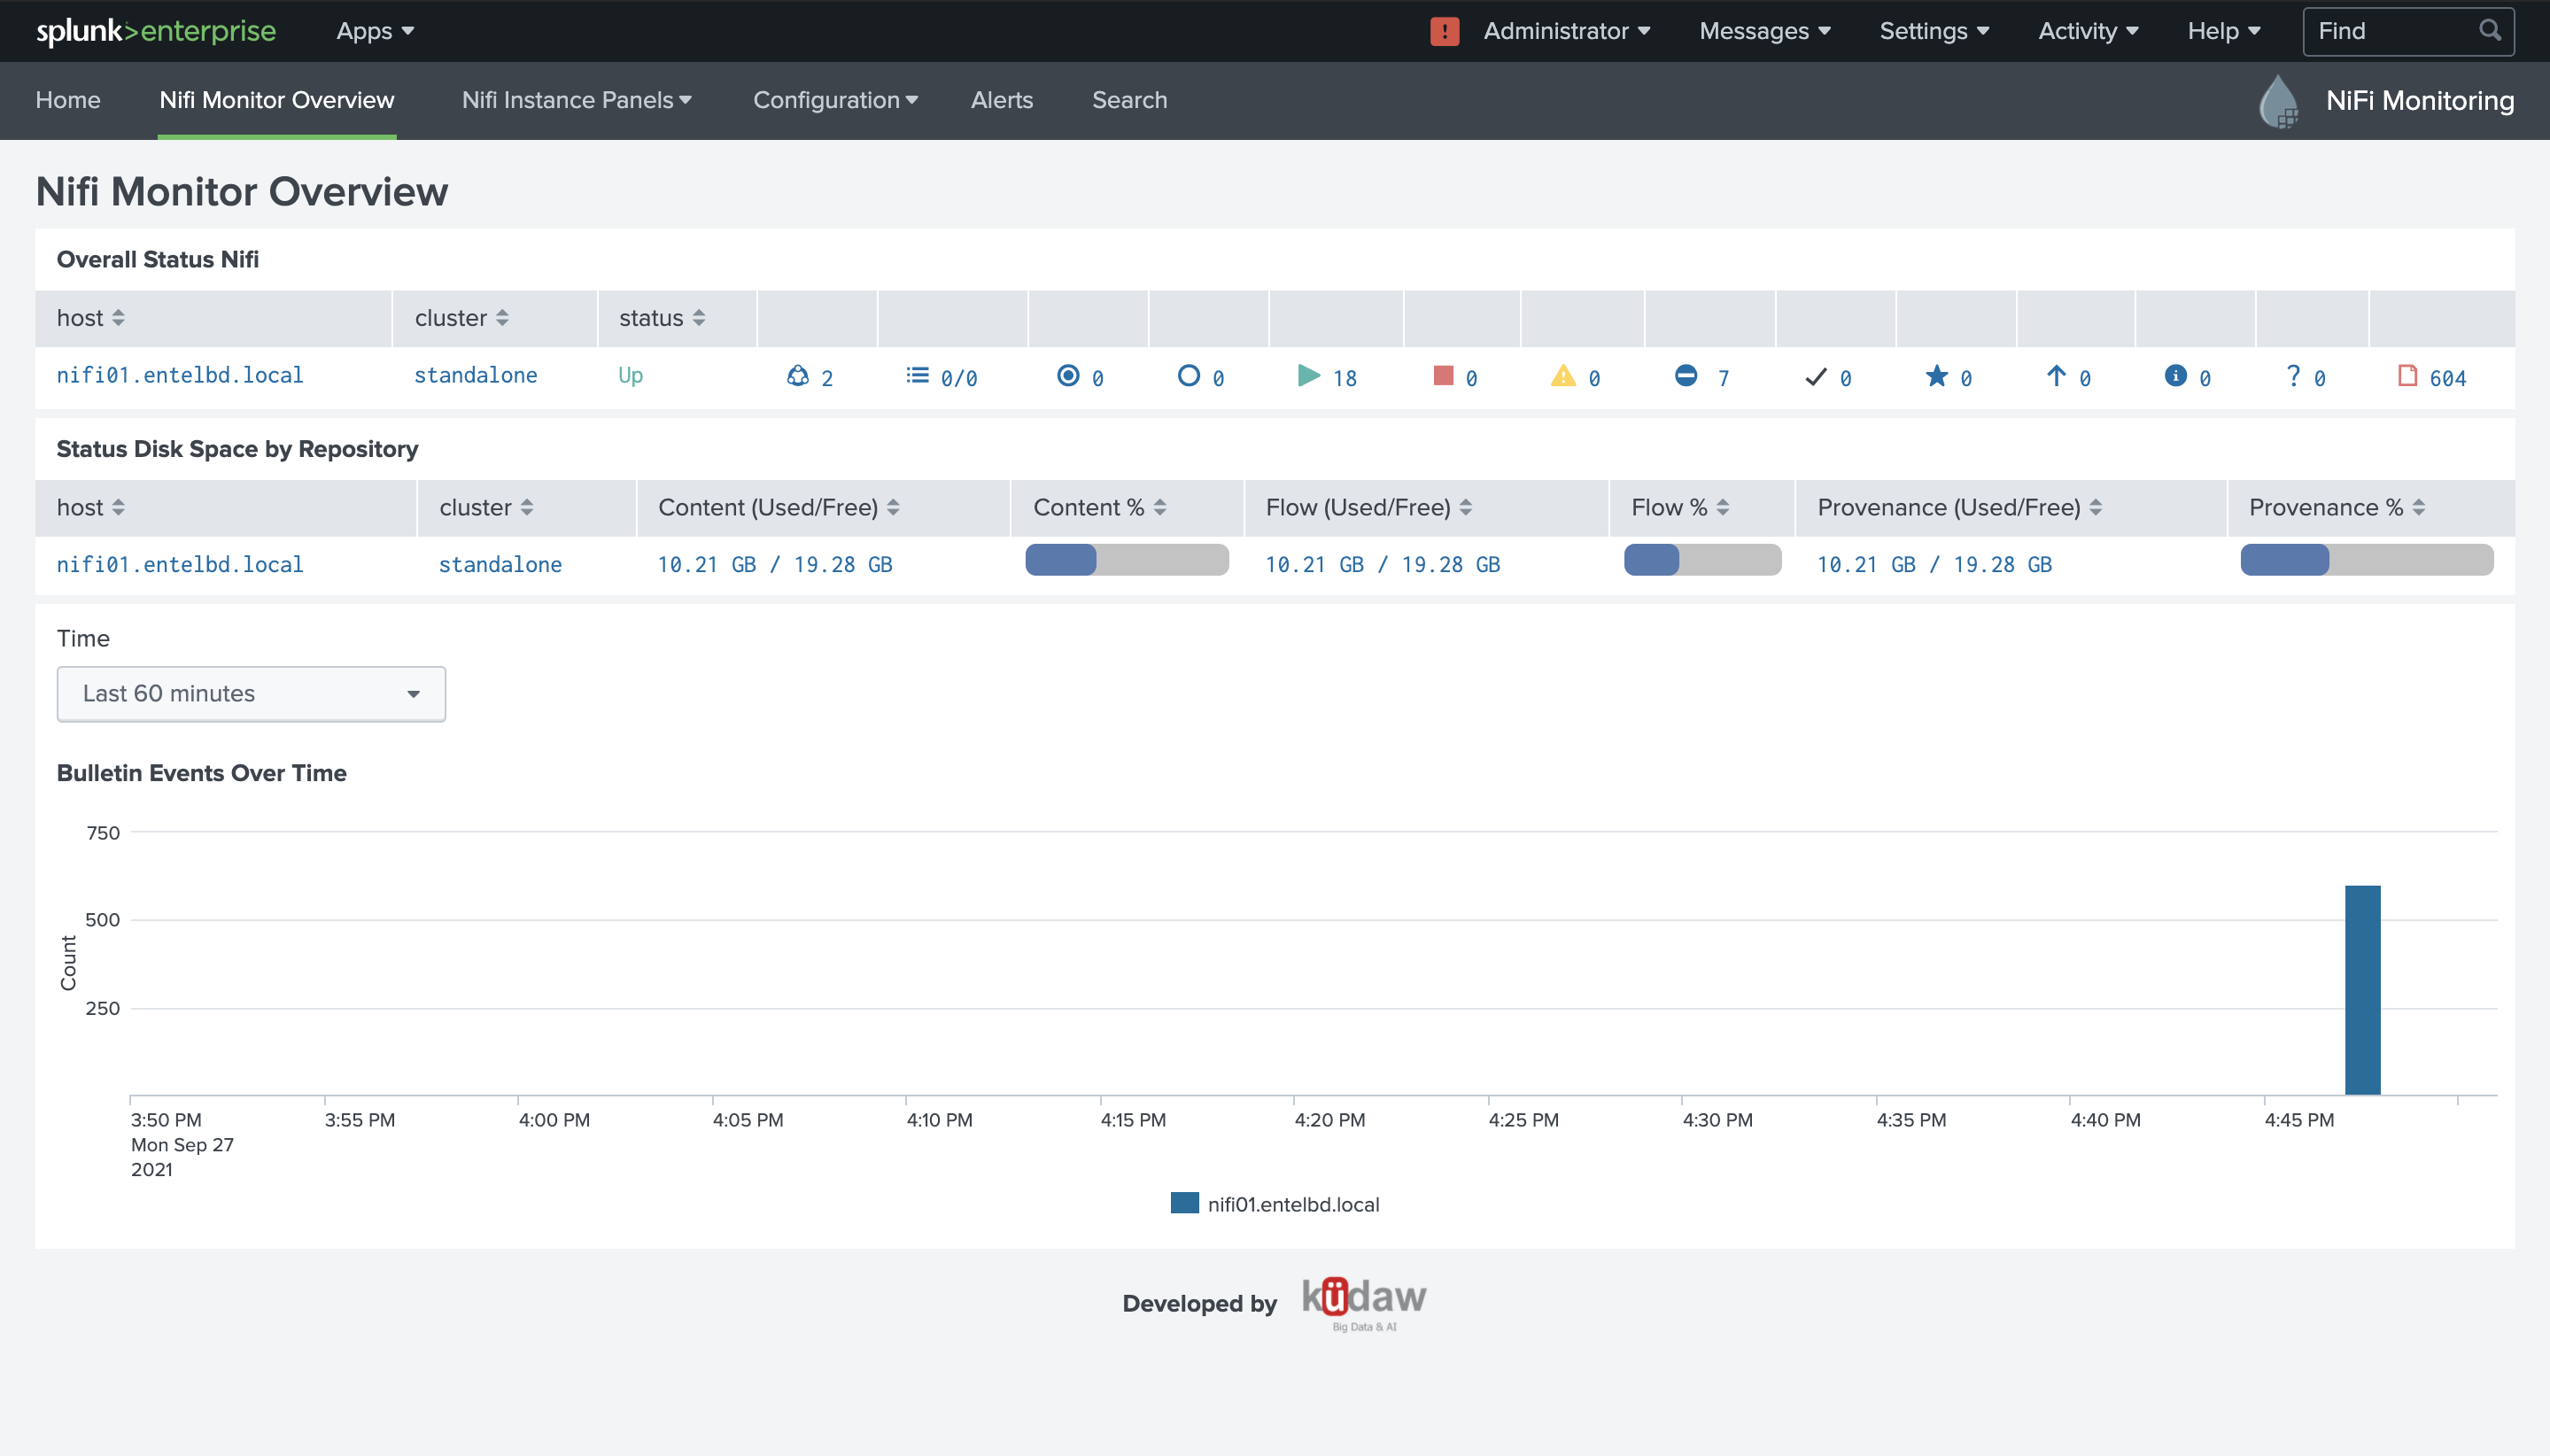
In the overview panel can see a summary of the different monitored NIFI servers, very similar to the top bar that we find in the initial application. The indicators are the following:
- Server status by node
- Repository status by node
- Bulletin error behavior by node
Nifi Instance Panels
In the next group of panels we will obtain details of different data sources, but analyzing the nodes individually.
Flow's & Metrics Monitoring Panel
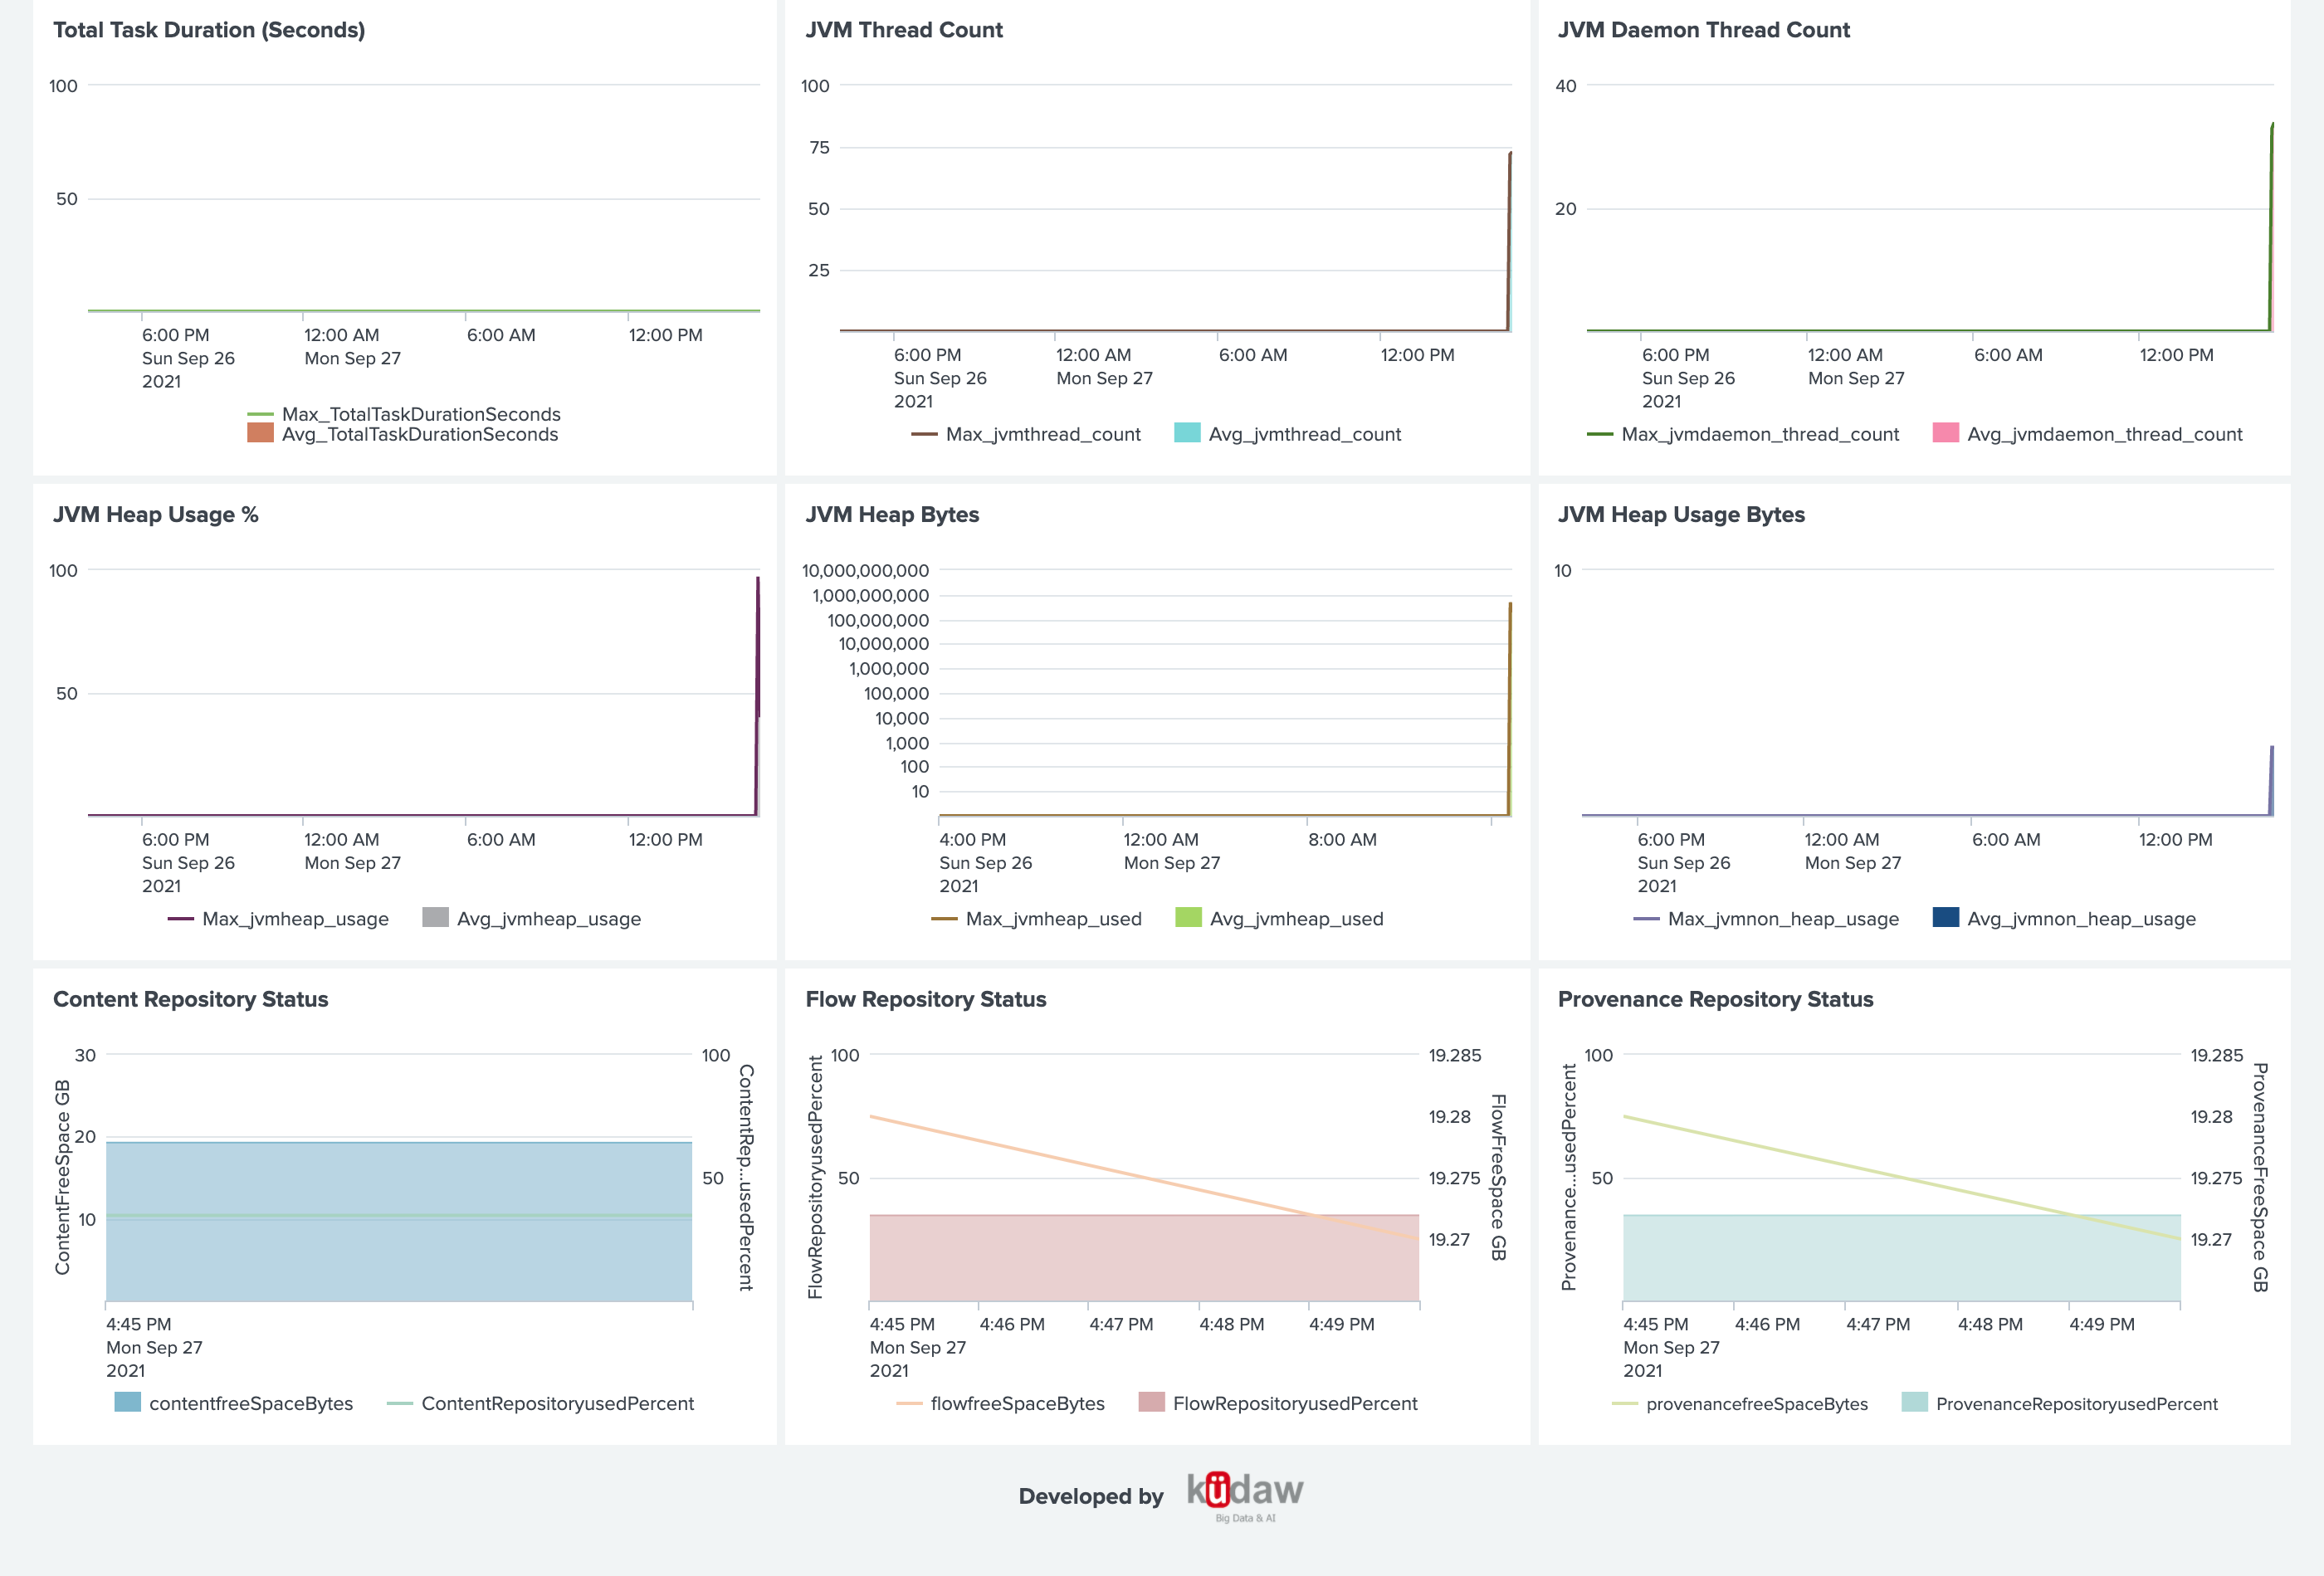
The following panel shows details of the node's operation, analyzing different performance metrics, as well as availability of use of some of the node's resources.
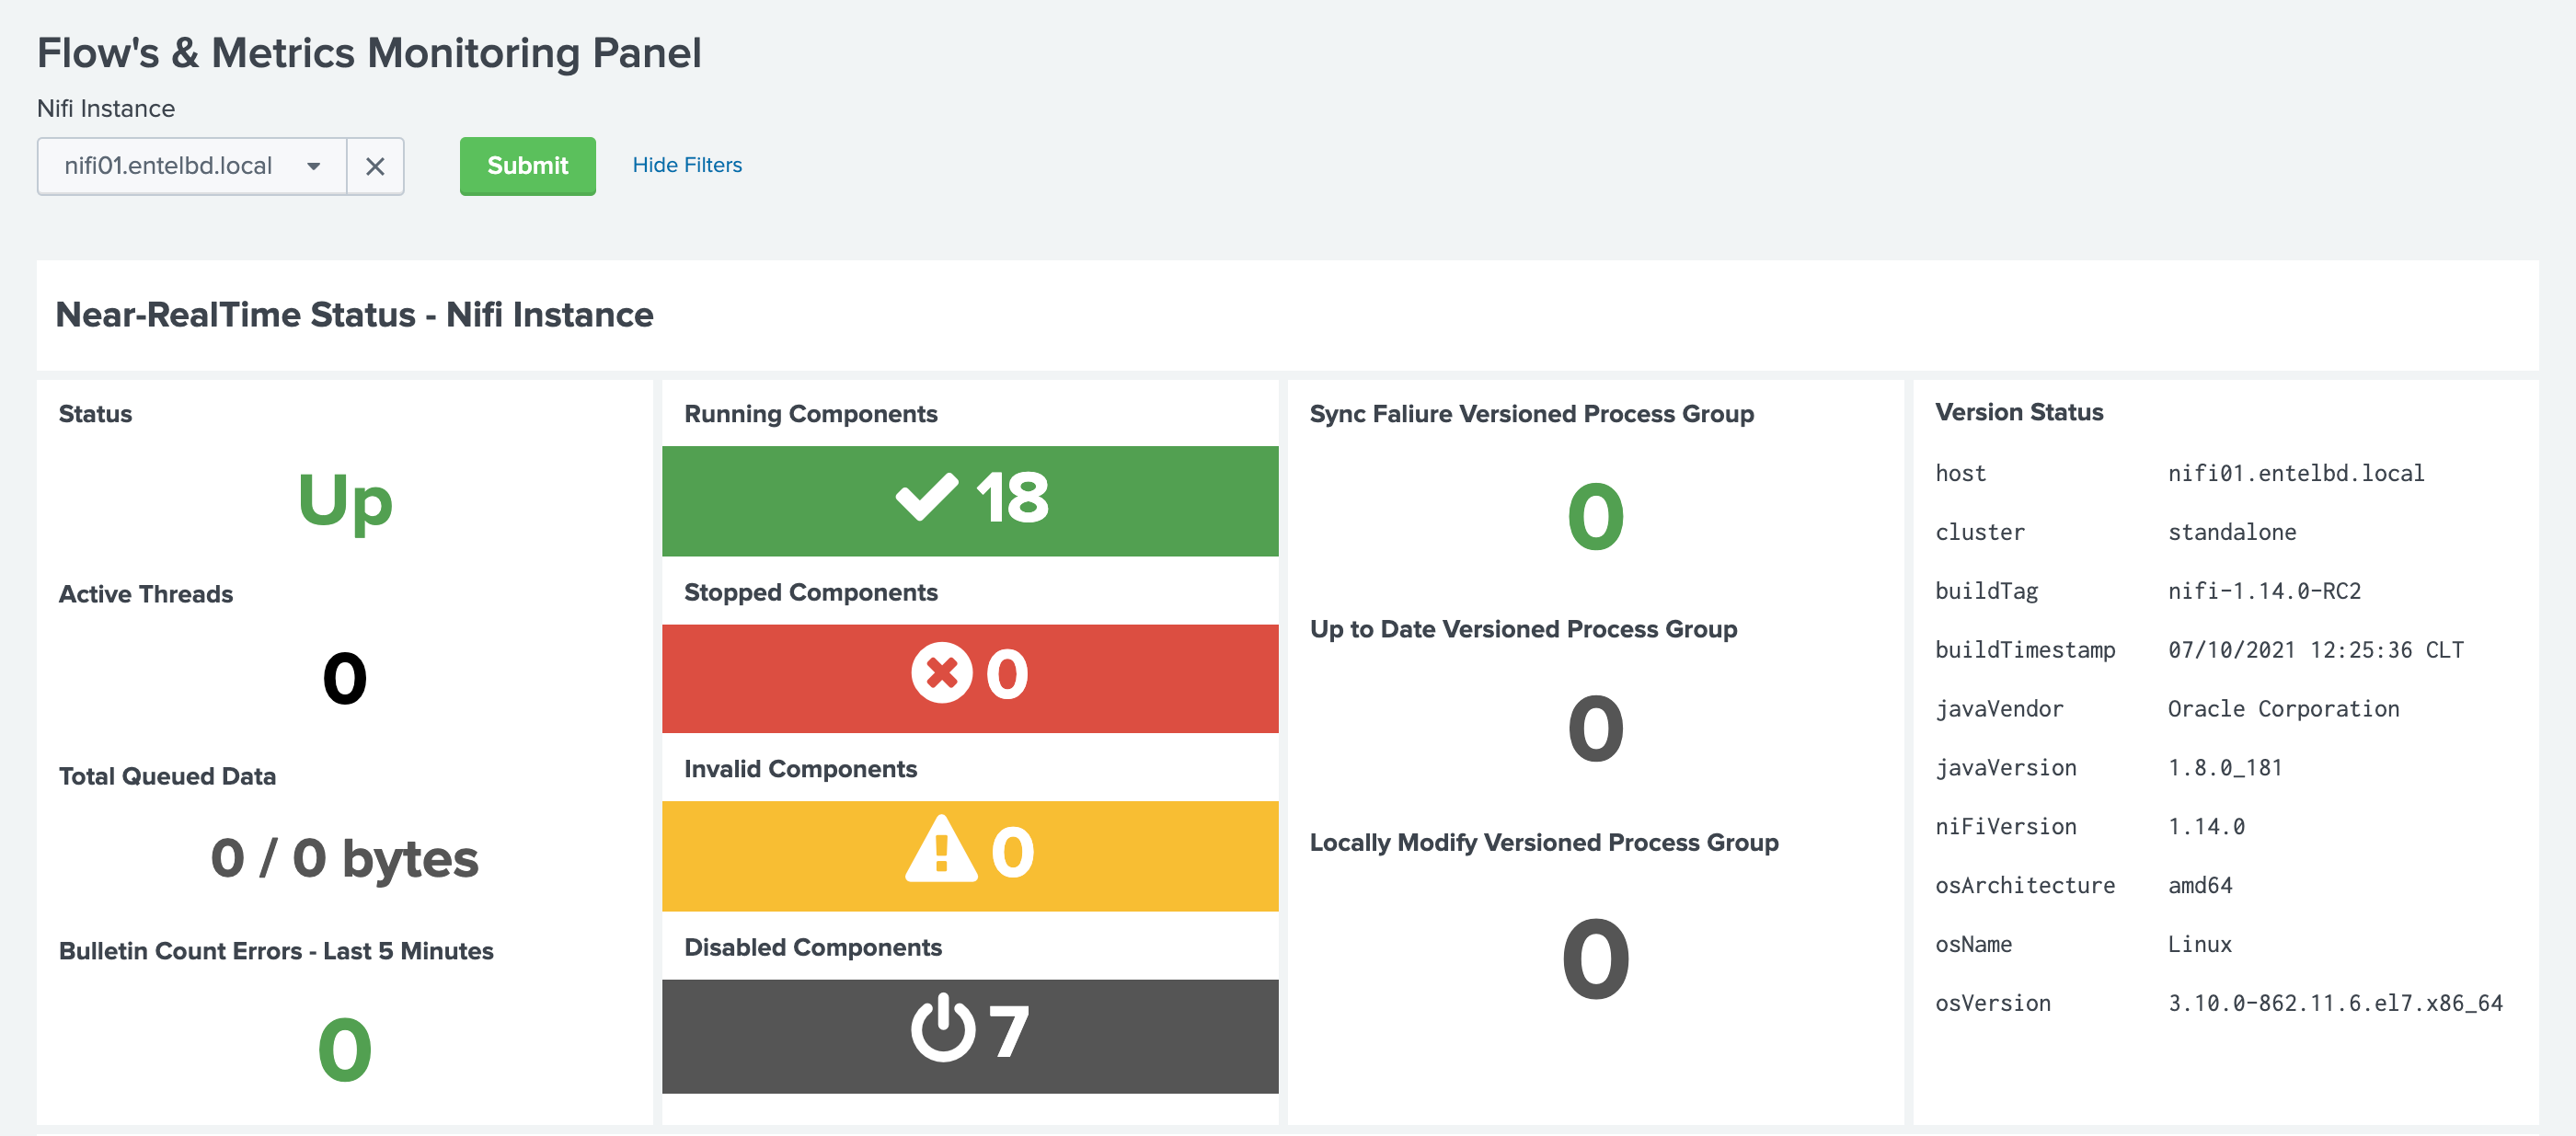
To make the data visualization more user-friendly, the panels have a series of scale selectors understanding the volume variability that a server can handle.
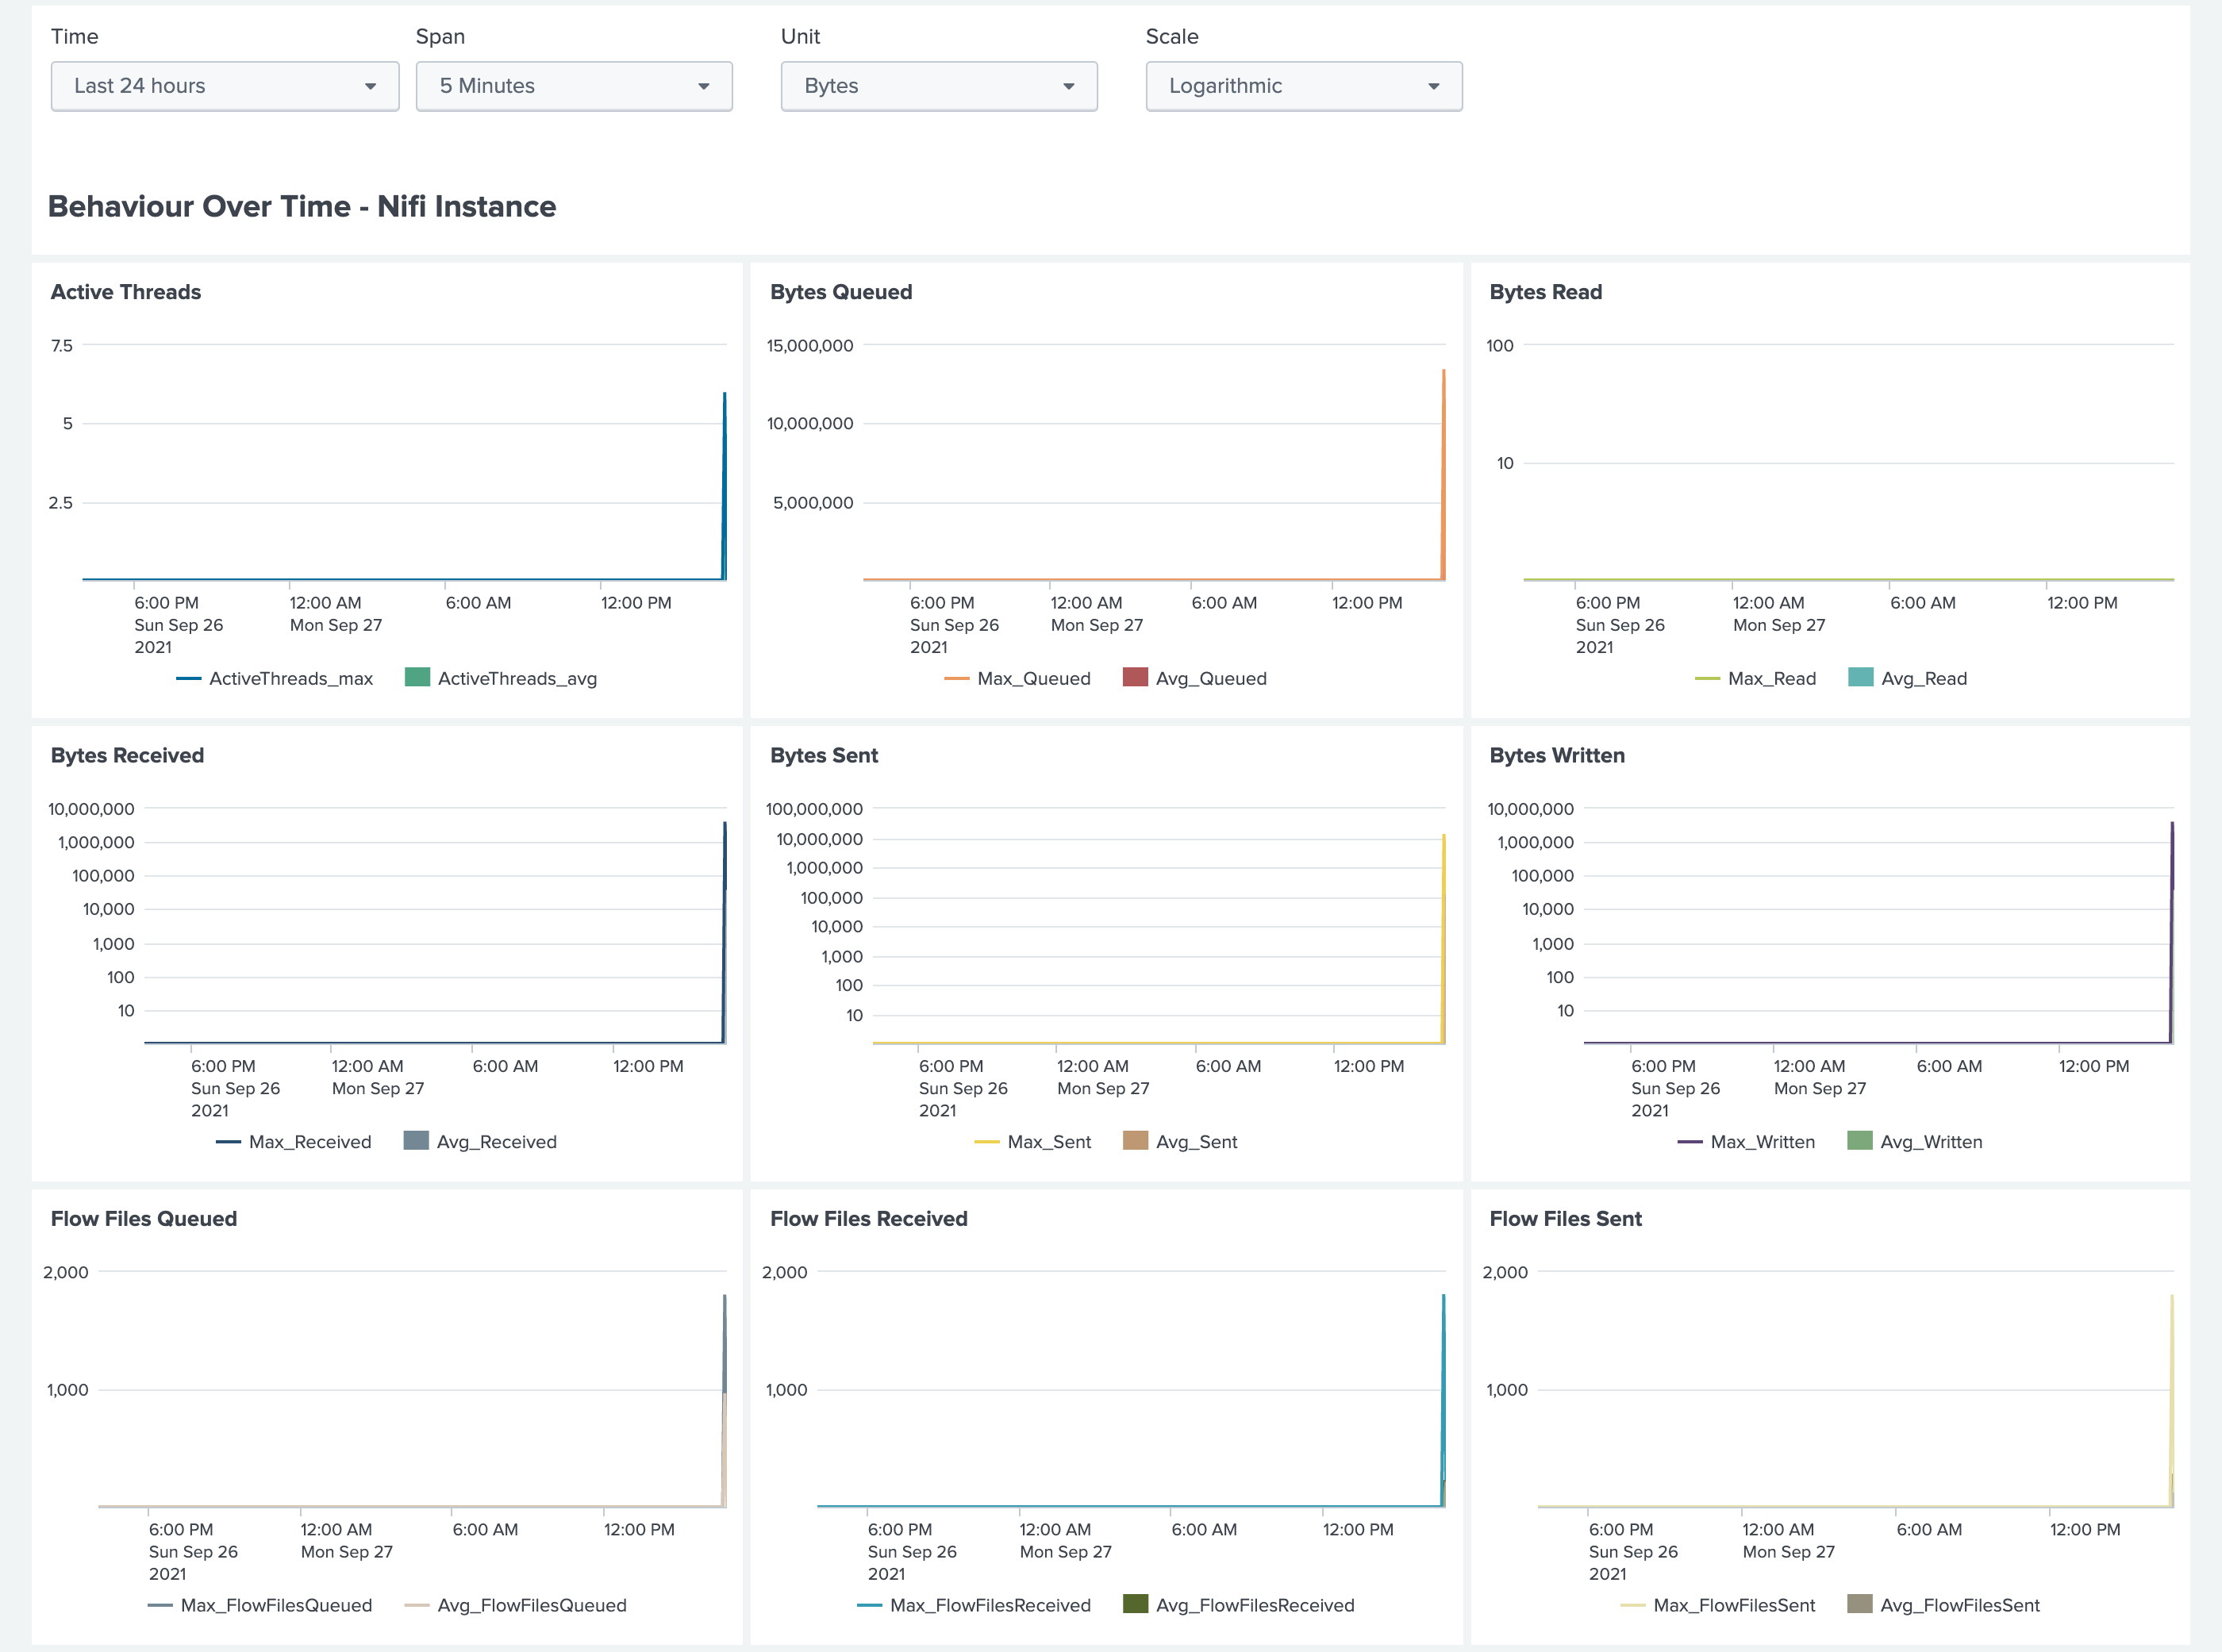
Additionally, information on the operational JVM is available in each node, and in this way have a complete view of the operation of the platform.
Bulletin Monitoring Panel
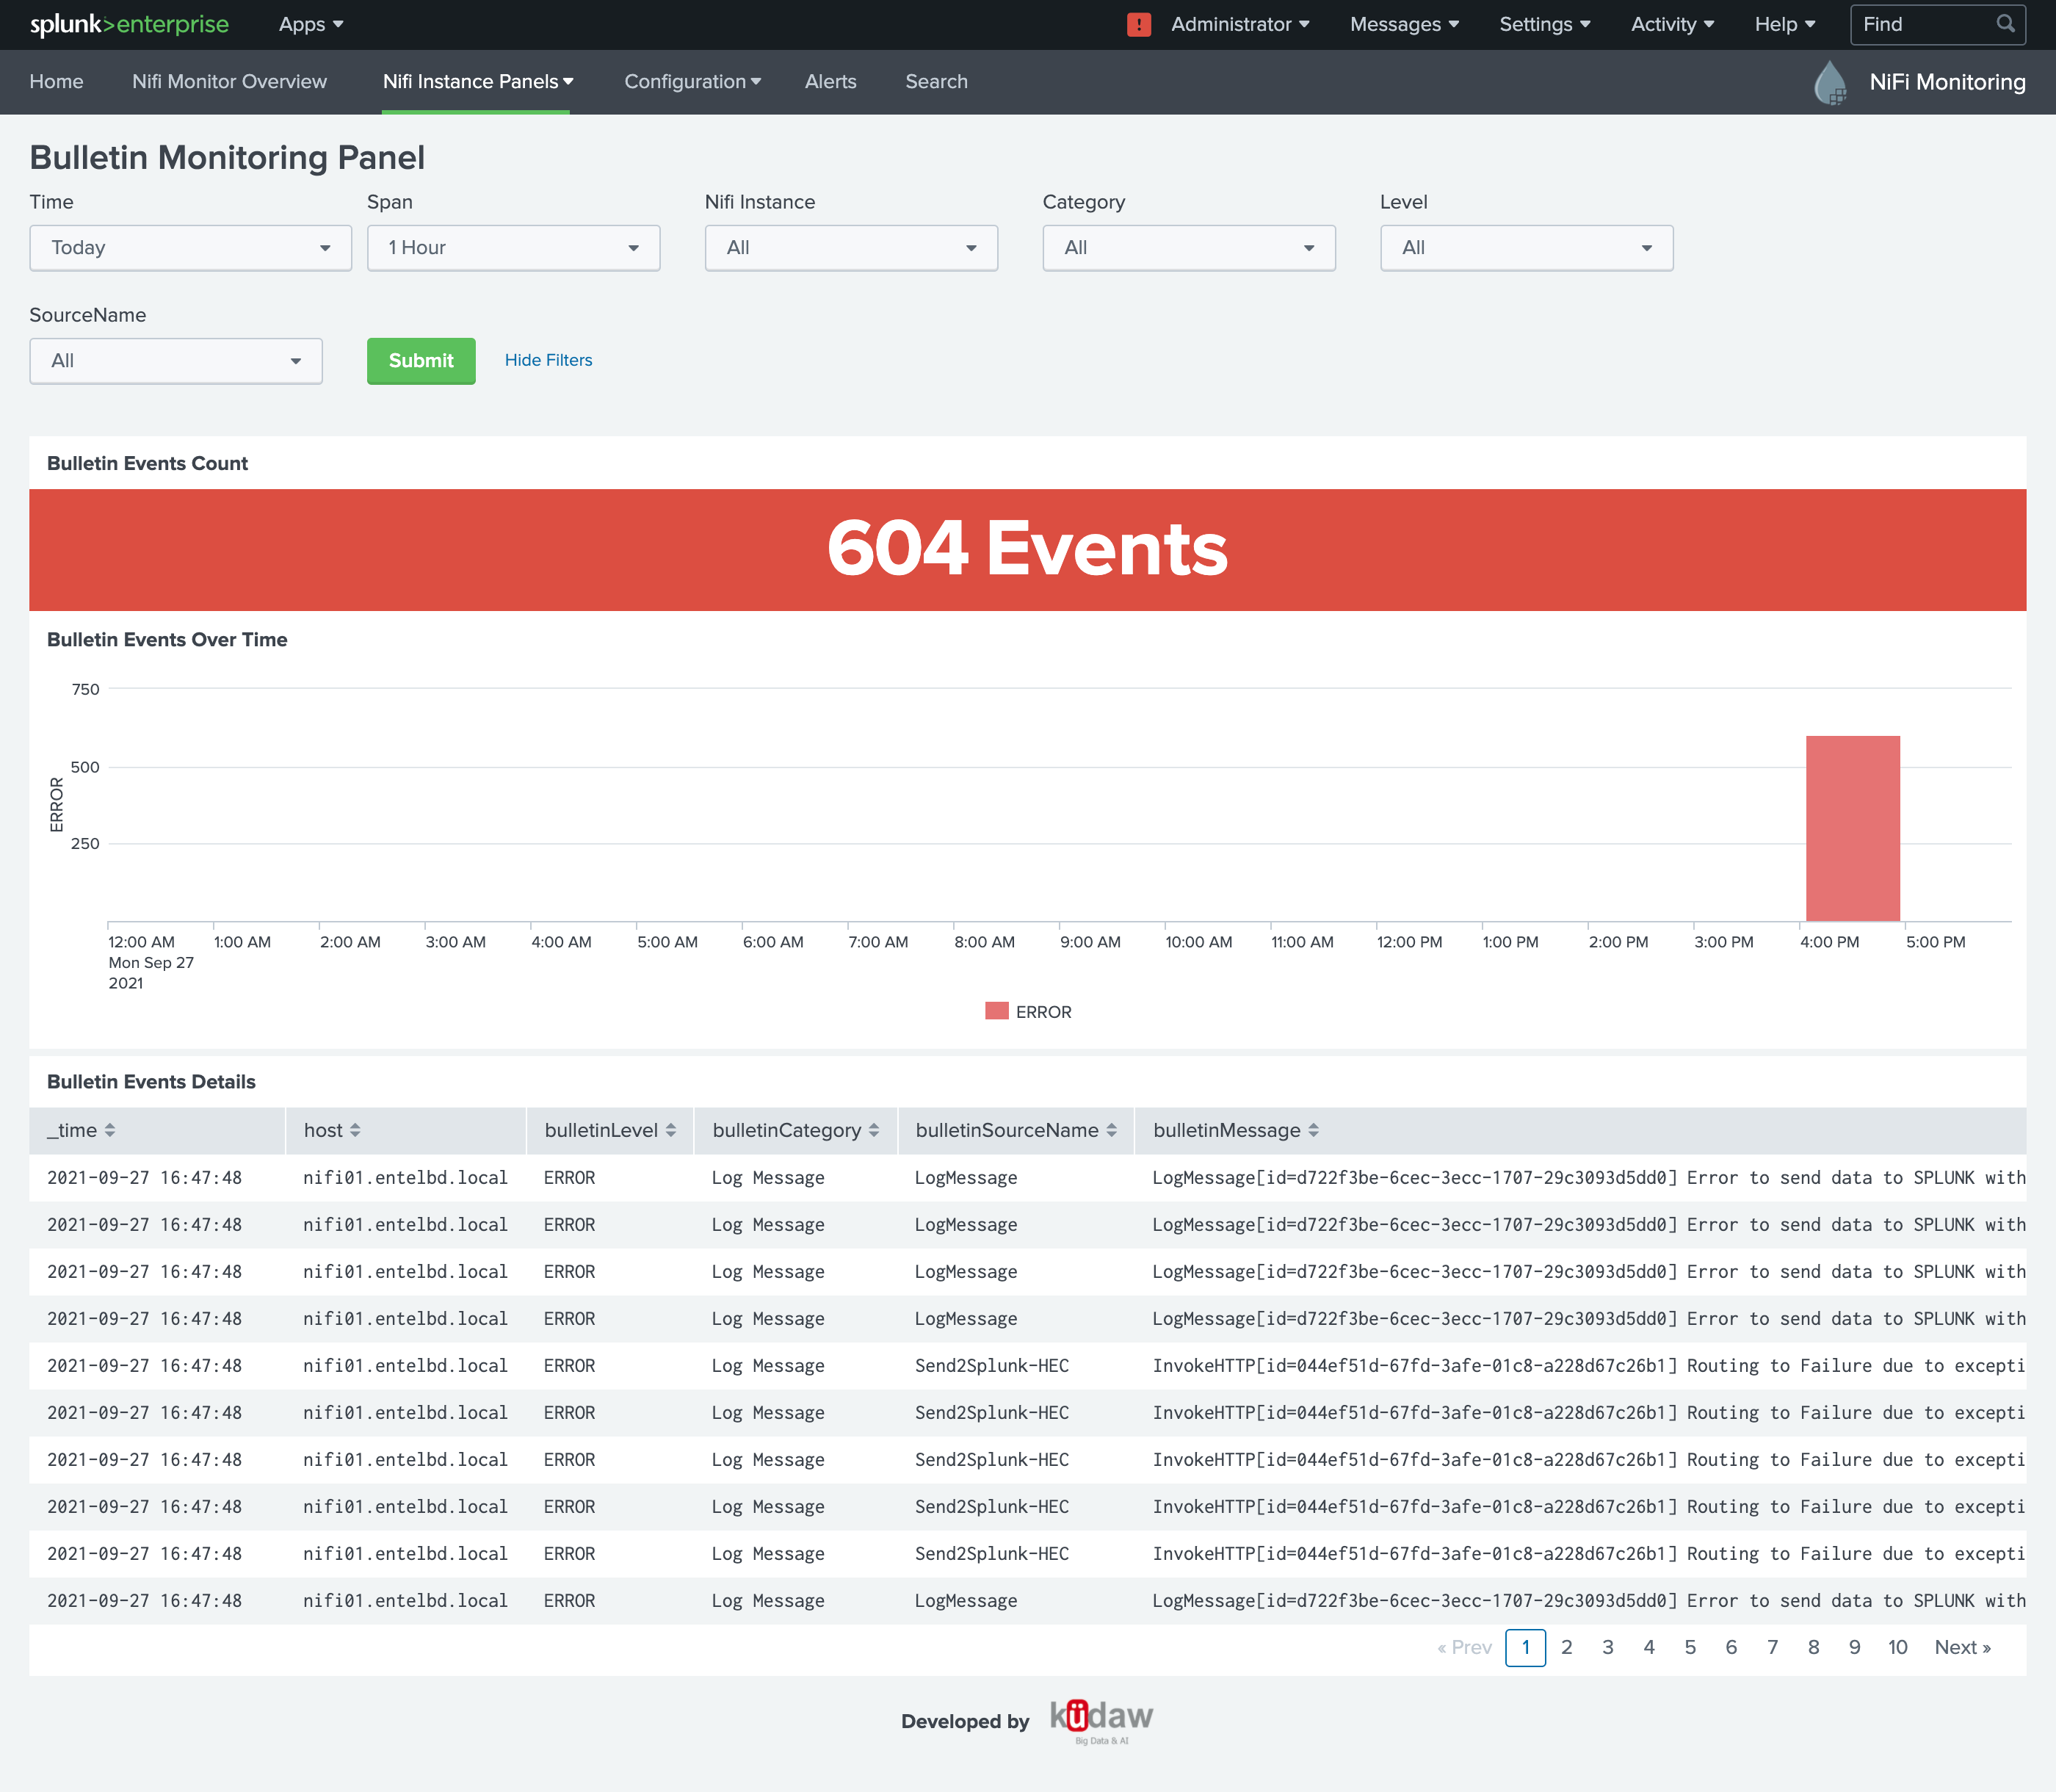
In the next panel, we can mainly observe the behavior of the errors of the bulletin system in NiFi, since it is very important in the event of an error to be able to carry out the correct traceability, in order to correct the situation as soon as possible.
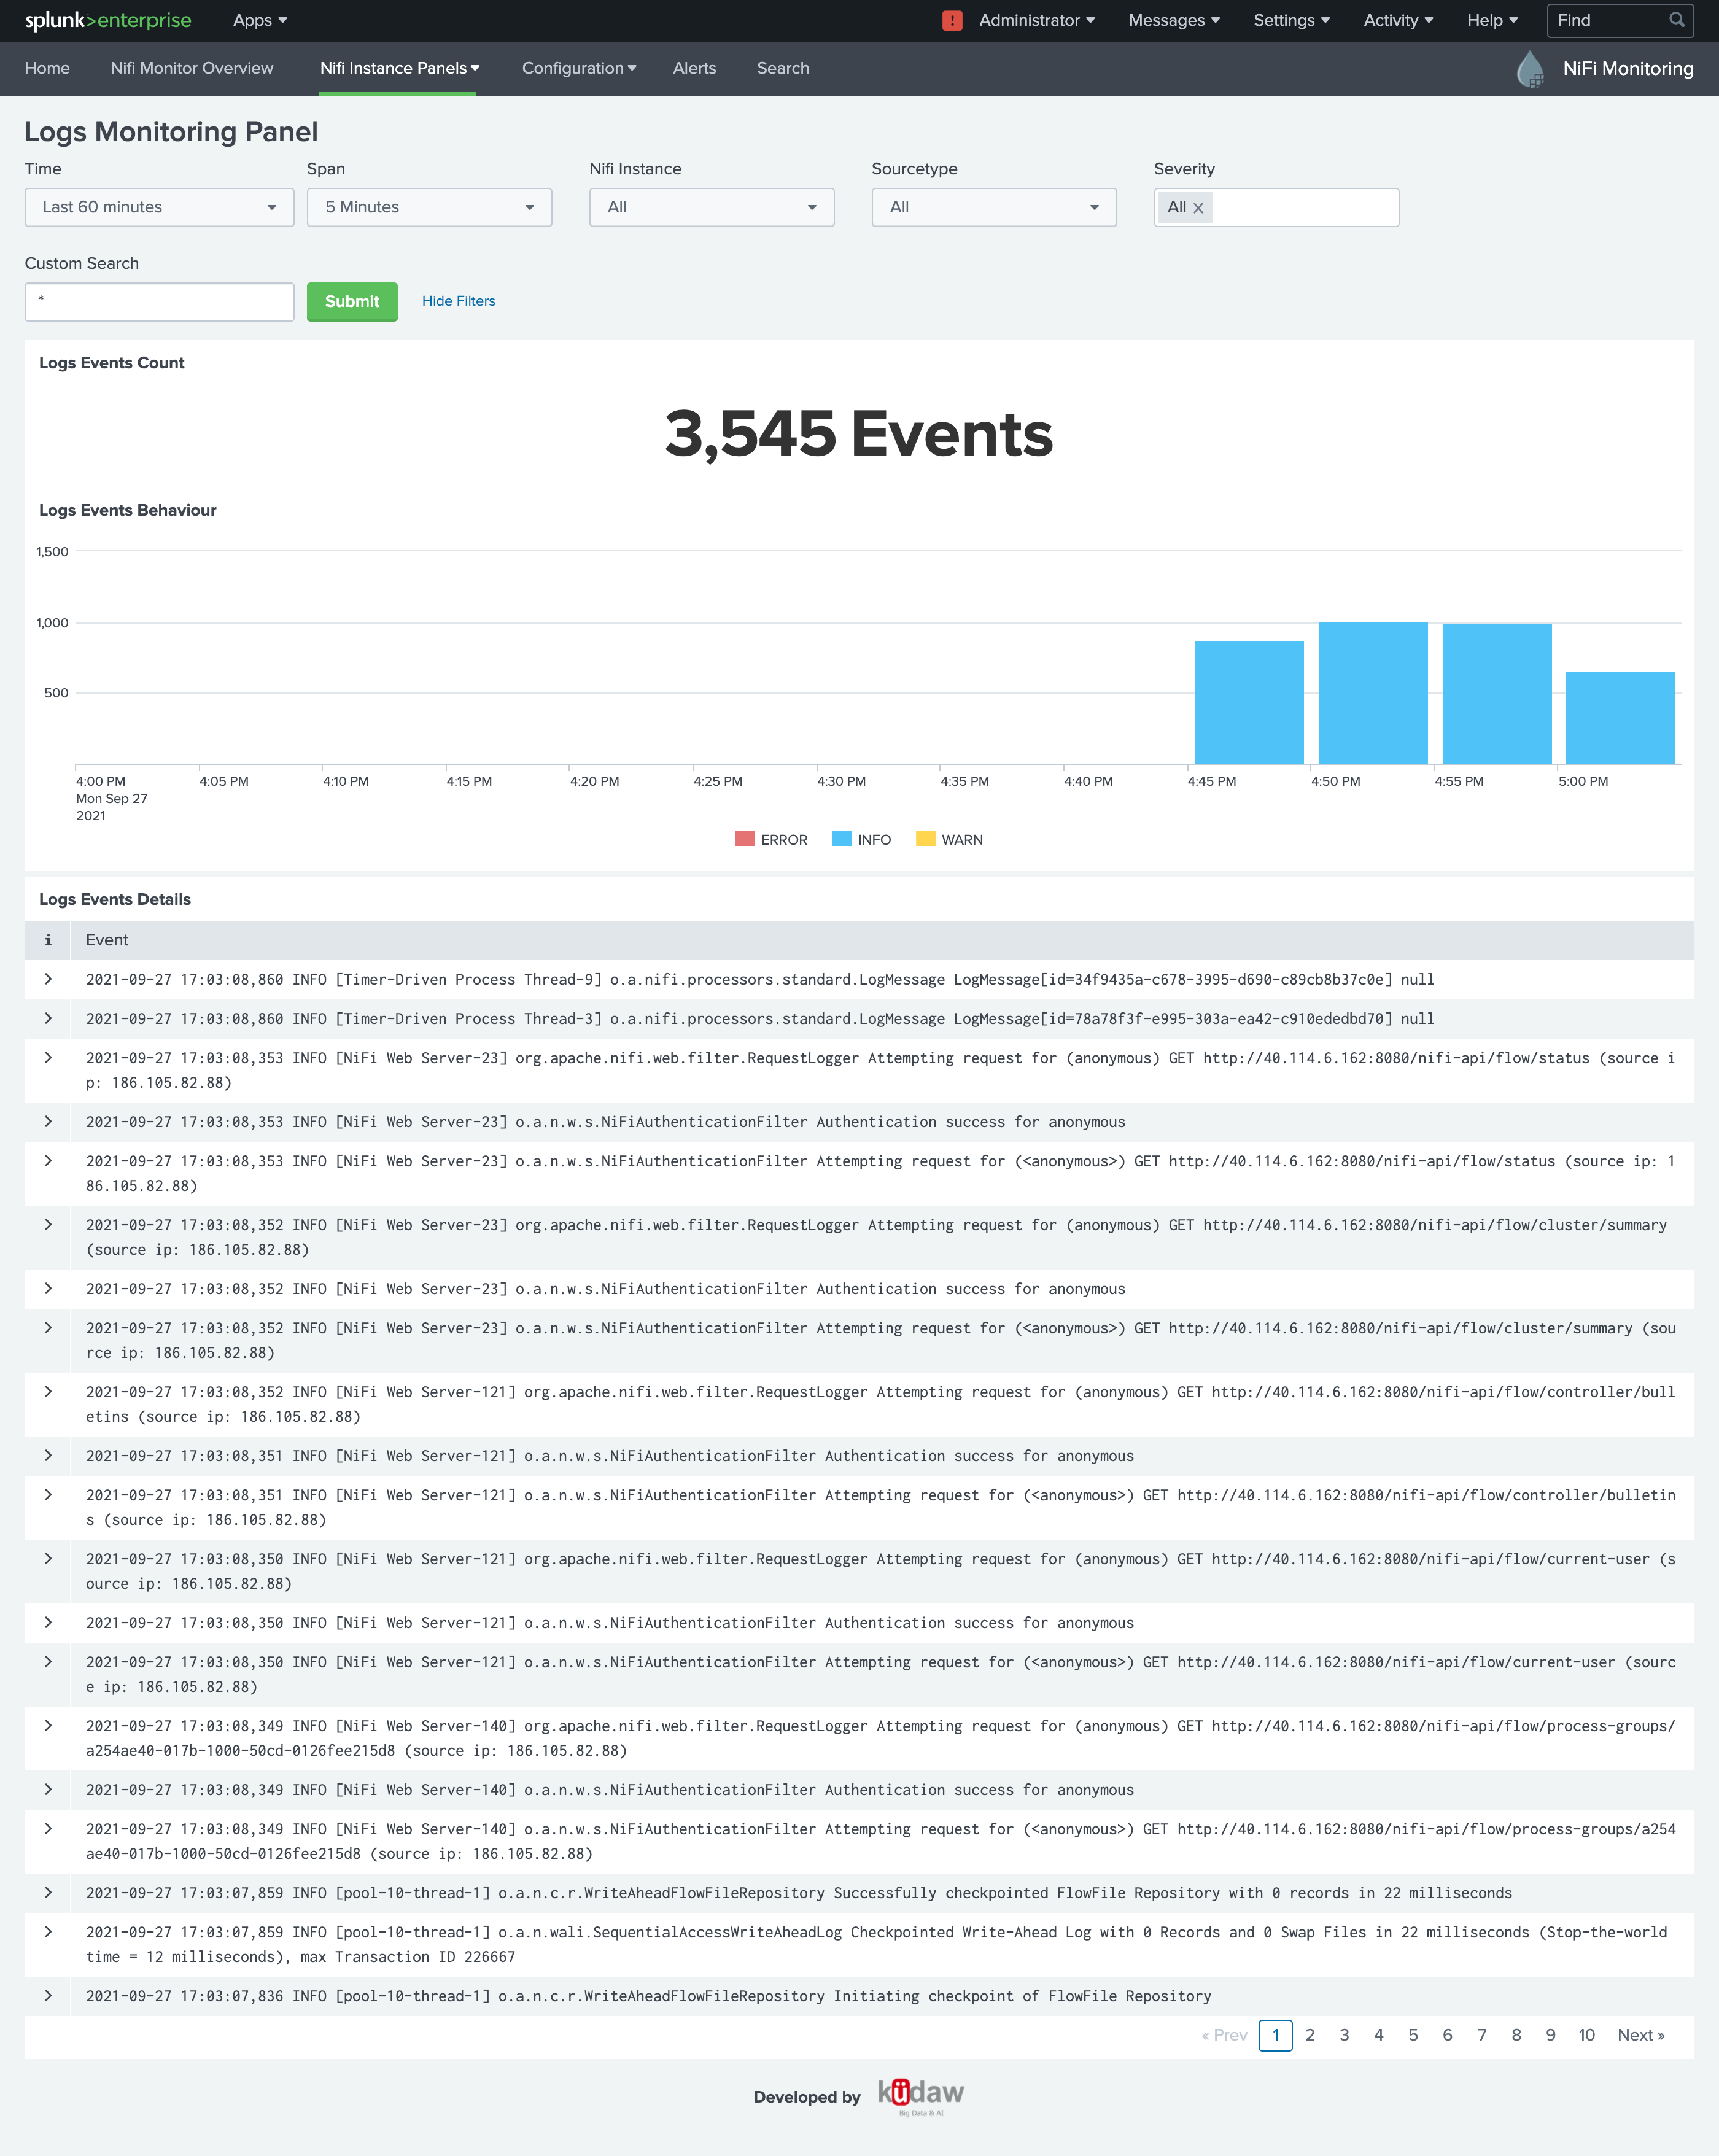
Logs Monitoring Panel
In the next panel, we can mainly observe the behavior of the errors of the bulletin system in nifi, since it is very important in the event of an error to be able to carry out the correct traceability, in order to correct the situation as soon as possible.
